
Overview

Problem

Technical Wall

Design Pivot

System Impact

Outcomes


AI-assisted Data Mapping
Human-AI Data Workflows that Reduce the Technical Floor for Global Onboarding
Solving for “Ingestion Debt” through ML-assisted mapping and Friction-by-Design governance
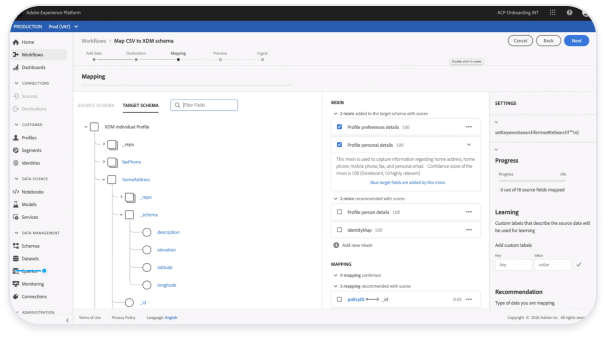
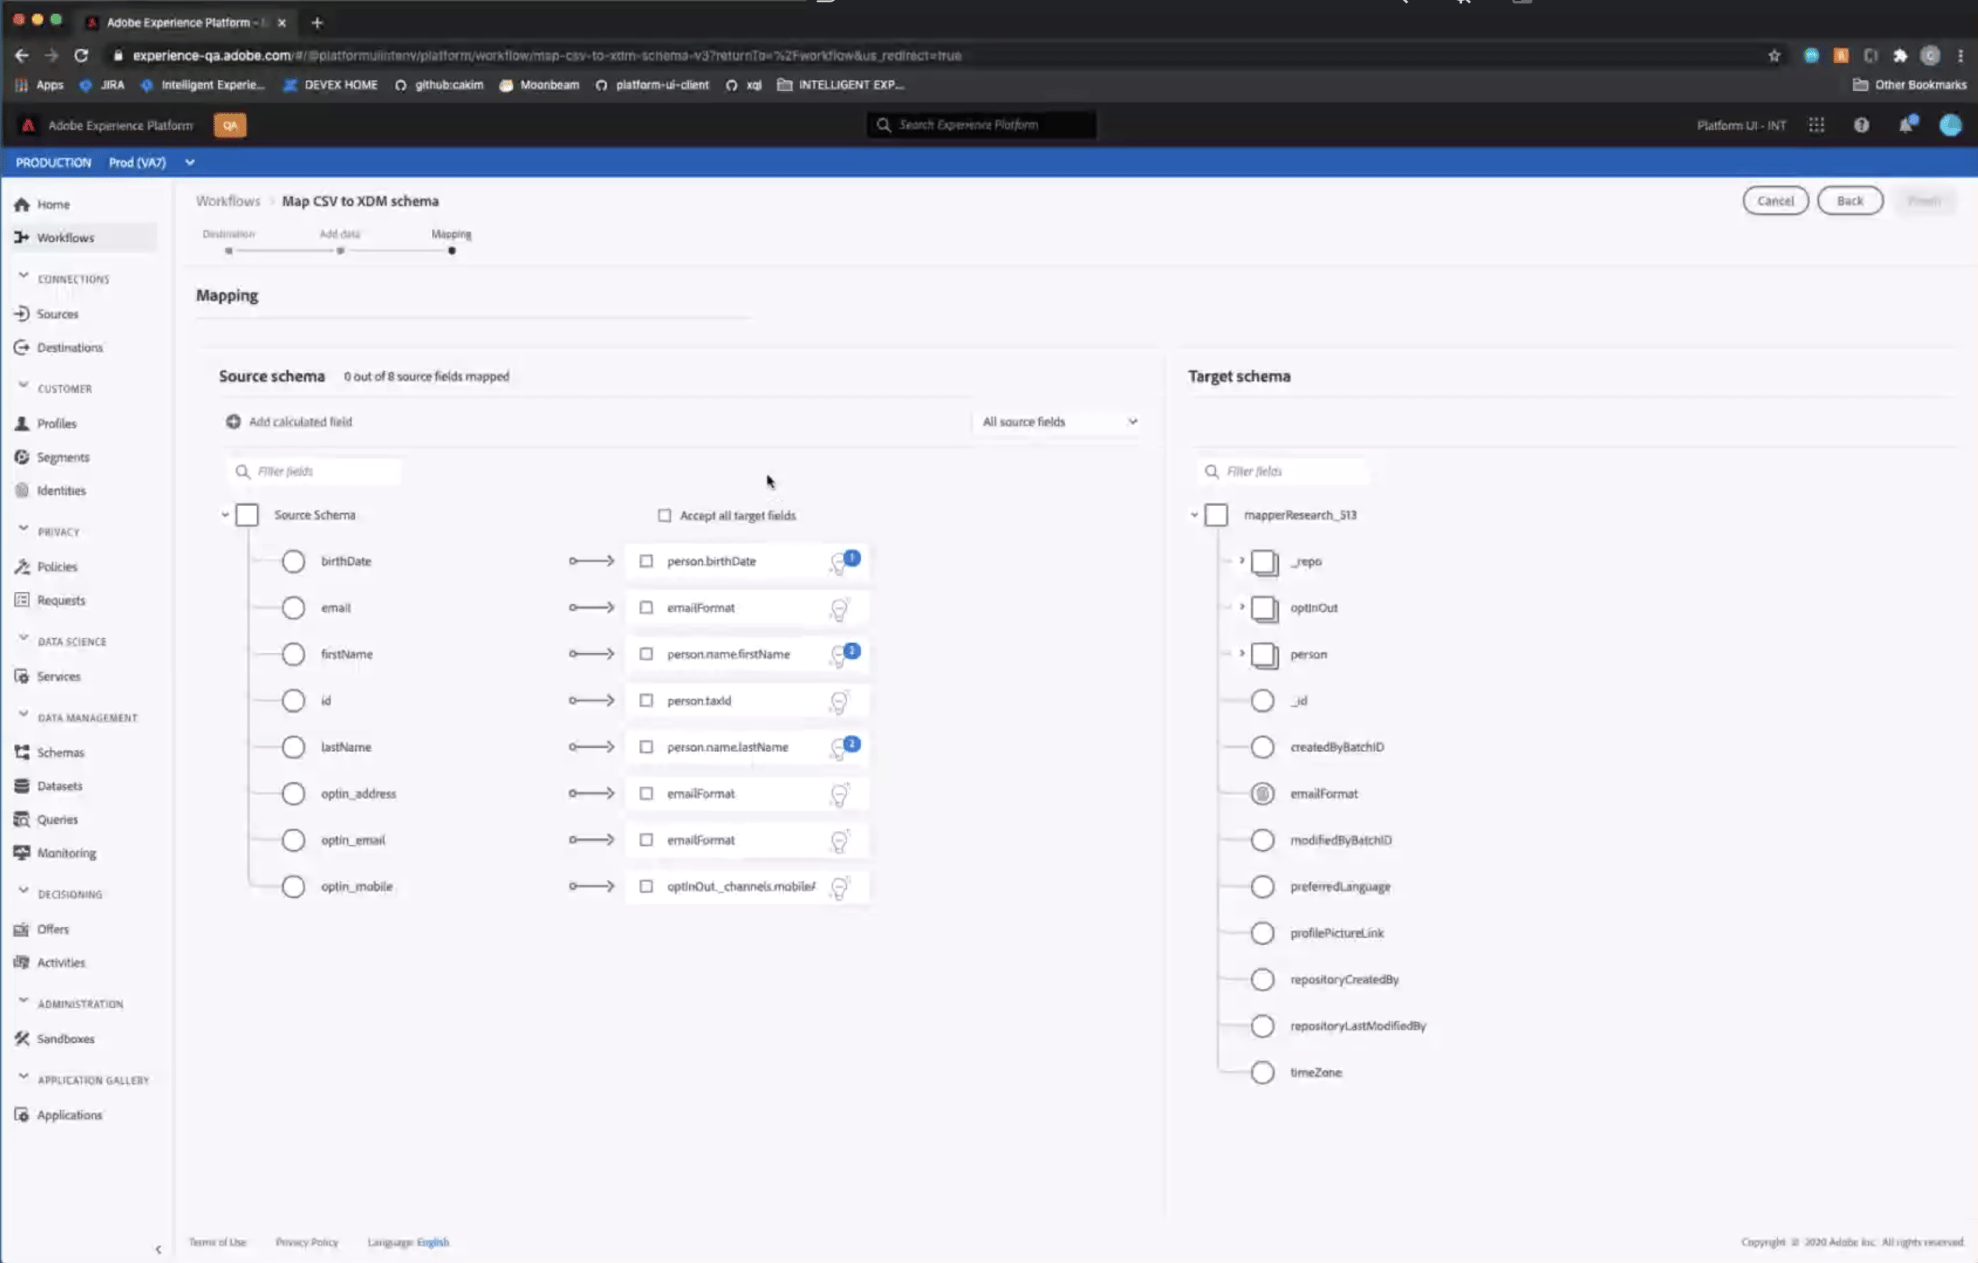
Data Mapping Overview

Project Snapshot
The Challenge
High-risk manual mapping created “Ingestion debt”, and errors discovered only after data reached the activation layer
The Solution
An ML-assisted mapping framework that balances automation with “Friction-by-Design” for PII governance.
Key Results
40-60% faster onboarding and a `30% reduction in mapping-related pipeline failures.
Primary Users
Data Engineers, Data Architects, and Marketing Ops teams.
Overview
This 0-GA initiative spanned 18 months, evolving from a manual field-matching tool into a Strategic Data Bridge. By standardizing how diverse source data enters the ecosystem, we established the foundational UX patterns for ML-recommendations, template reuse, and proactive drift monitoring.
My Role
As the Primary Design Lead, I orchestrated the end-to-end workflow across ingestion and mapping. I partnered with 2 Product Managers (including a domain SME) and a squad of Backend/Frontend Engineers to translate complex ML confidence scores into actionable, high-integrity UI patterns.
The Problem
The Cost of “Invisible Errors”
The Core Tension: Speed vs Governance
Historically, mapping diverse source data into a standardized schema was a “black box” operation. Users were forced to map fields manually without knowing if the data types matched downstream requirements, leading to what I termed “Ingestion Debt”.
Silent Pipeline Pollution
Architects would “successfully” map fields that appeared valid in the UI, but contained semantic mismatches. These errors remained invisible until they triggered failures in downstream segmentation.
The Late-Stage Error Loop
Errors were only discovered at the “Activation” layer (often weeks after initial setup), forcing teams to restart the 18-month onboarding cycles from scratch.
The Governance Risk
Without clear visibility into PII (Personally Identifiable Information), sensitive data often leaked into non-compliant destinations.
Critical
Mis-mapped fields produced incomplete or inaccurate audiences
High
Source onboarding and schema selection lacked clarity
High
Errors surfaced late, triggering rework and support tickets
Medium
No templates or reuse lead to repetitive manual effort
Source Fields Flow Analysis
Visualizing the Fragmentation Gap: Identifying where unmapped source fields caused downstream segmentation to fail.
Correct Mappings
90% • Activation-ready
10% • Shadow QA
Incorrect Mappings
60% • Failed activation
10% • Low-precision segment
Unmapped Fields
100% • Backlog


Backlog (10)
Low-precision segment (08)
Failed activation (12)
QA monitoring (07)
Activation-ready (63)
Correct (70)
Incorrect (20)
Unmapped (10)
(100) Source Fields
2 Stages Earlier
Error detection improvements
↓ 2 Reduced Costs
Fix issues before campaign launch
↑ Confidence
In automation and personalization
Error Discovery Timeline
The Cost of Late Discovery: Mapping errors occurred at Hour 1 but remained invisible until the Activation phase at Month 18


Early Detection
(Proposed)
Source
Connection

Field Mapping/
Validation
Segment
Build
Campaign


Error Detected
(Before)
Error Detected
(Before)
Unified
Profile Schema
Cross-team Journey Map
Mapping workflow and failure analysis helped identify where segmentation breaks, why it happens, and who it impacts.
Critical
Late error detection & schema drift created unclear mapping outcomes
Leads to rework loops, broken segments, and failed activation
High
Ambiguous fields along with tribal knowledge drive mis-mapping and low trust
Slows onboarding and reduces confidence in audiences
Medium
Manual and repetitive mapping with limited tooling
Increases time to first segment and hurts scalability
The Technical Wall
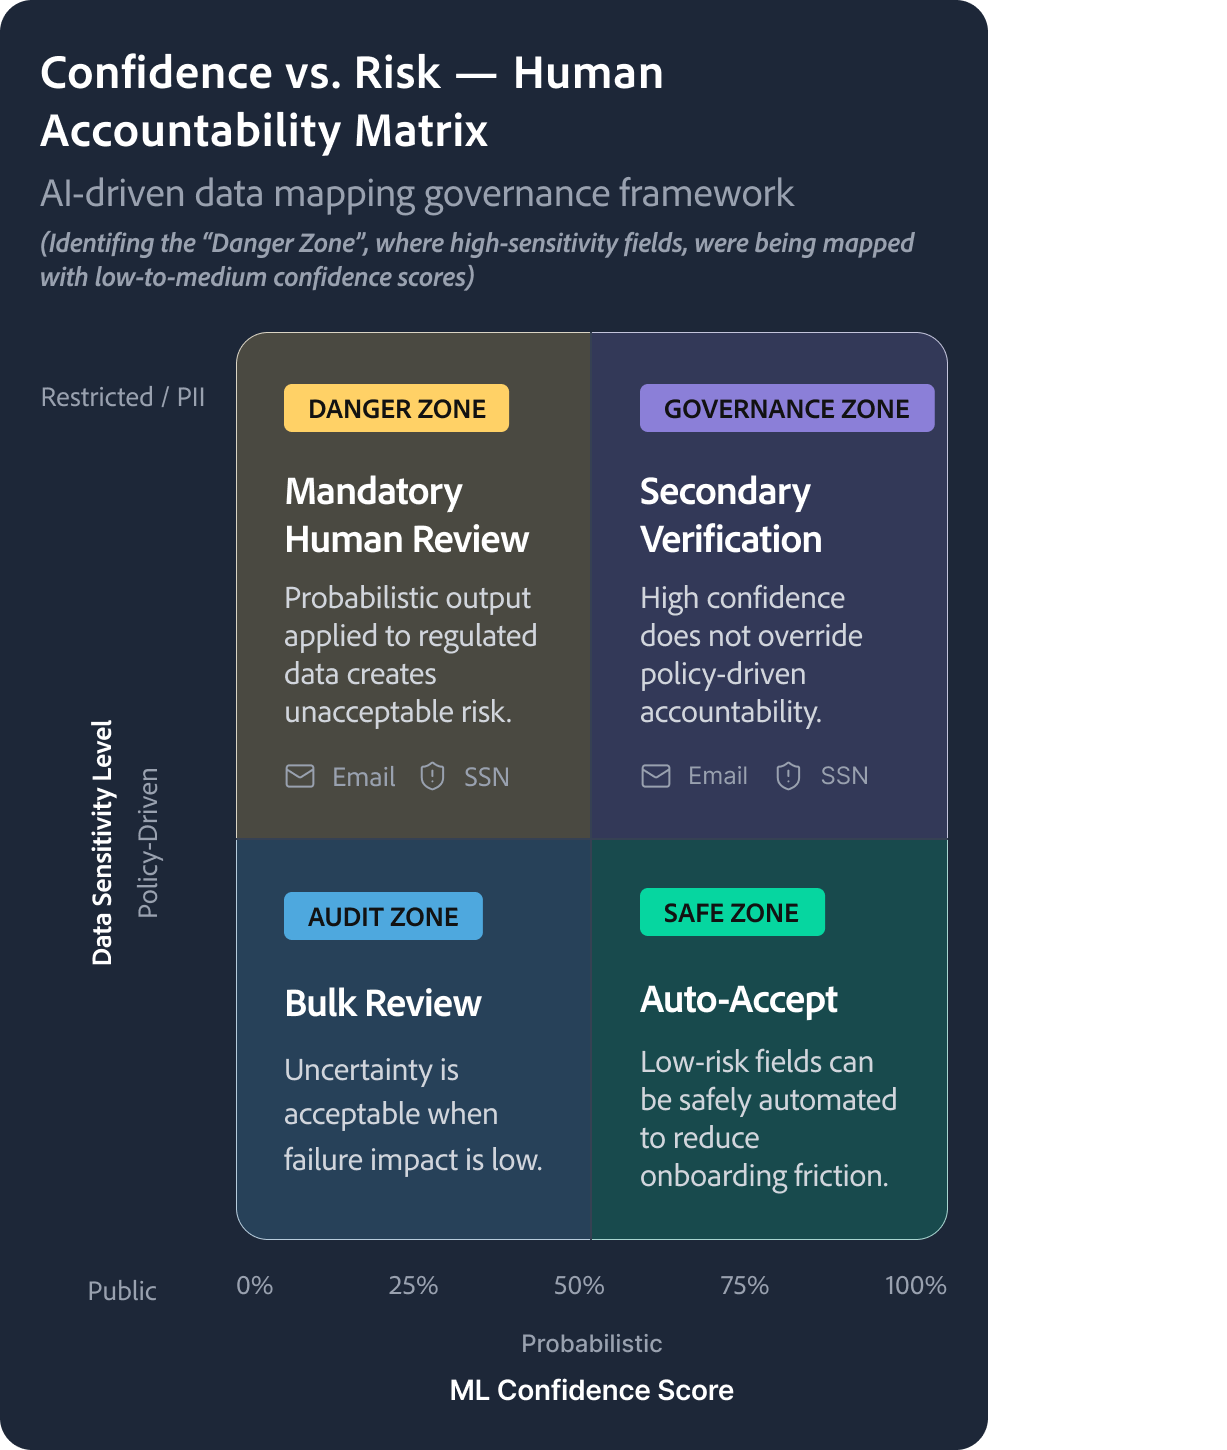
The Probability vs Policy Paradox
The Constraint: AI is Probabilistic, Governance is Binary
The core technical challenge was that out ML models produced Confidence Scores, not certainties. In a consumer app, an 80% match is a win; in Enterprise PII (Personally Identifiable Information) mapping, a 20% margin of error is a legal and structural liability.
The Black Box Problem
The Wall
Early versions of the ML-mapping engine “just worked,” but provided no “why” behind the suggestions.
User Mistrust
Architects, wary of “Silent Pipeline Pollution.” would spend more time auditing the AI’s work than it would have taken to map the fields manually.
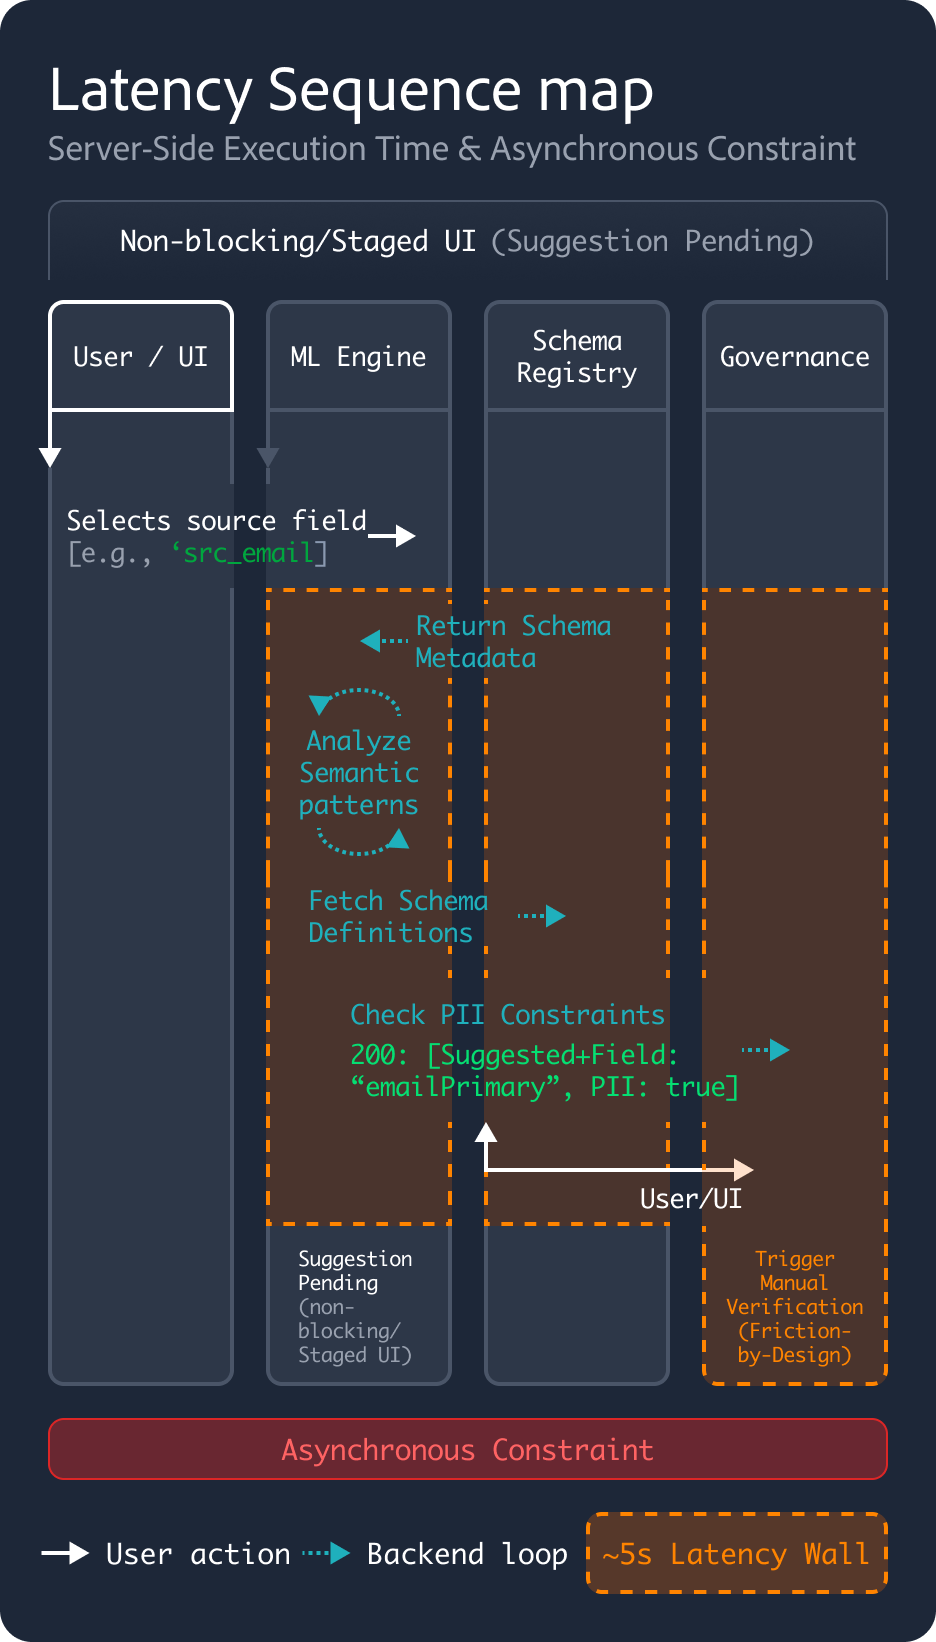
Performance Reality
Backend processing for real-time ML suggestions across 1,000+ fields introduced a 5-second latency, threatening the “consumer-grade” flow UX had initially promised.
The Mapping Paradox
If we automated everything, we lost human accountability for PII. If we automated nothing, we couldn’t lower the technical floor for onboarding.
The Design Pivot
From System Constraints to User Flows
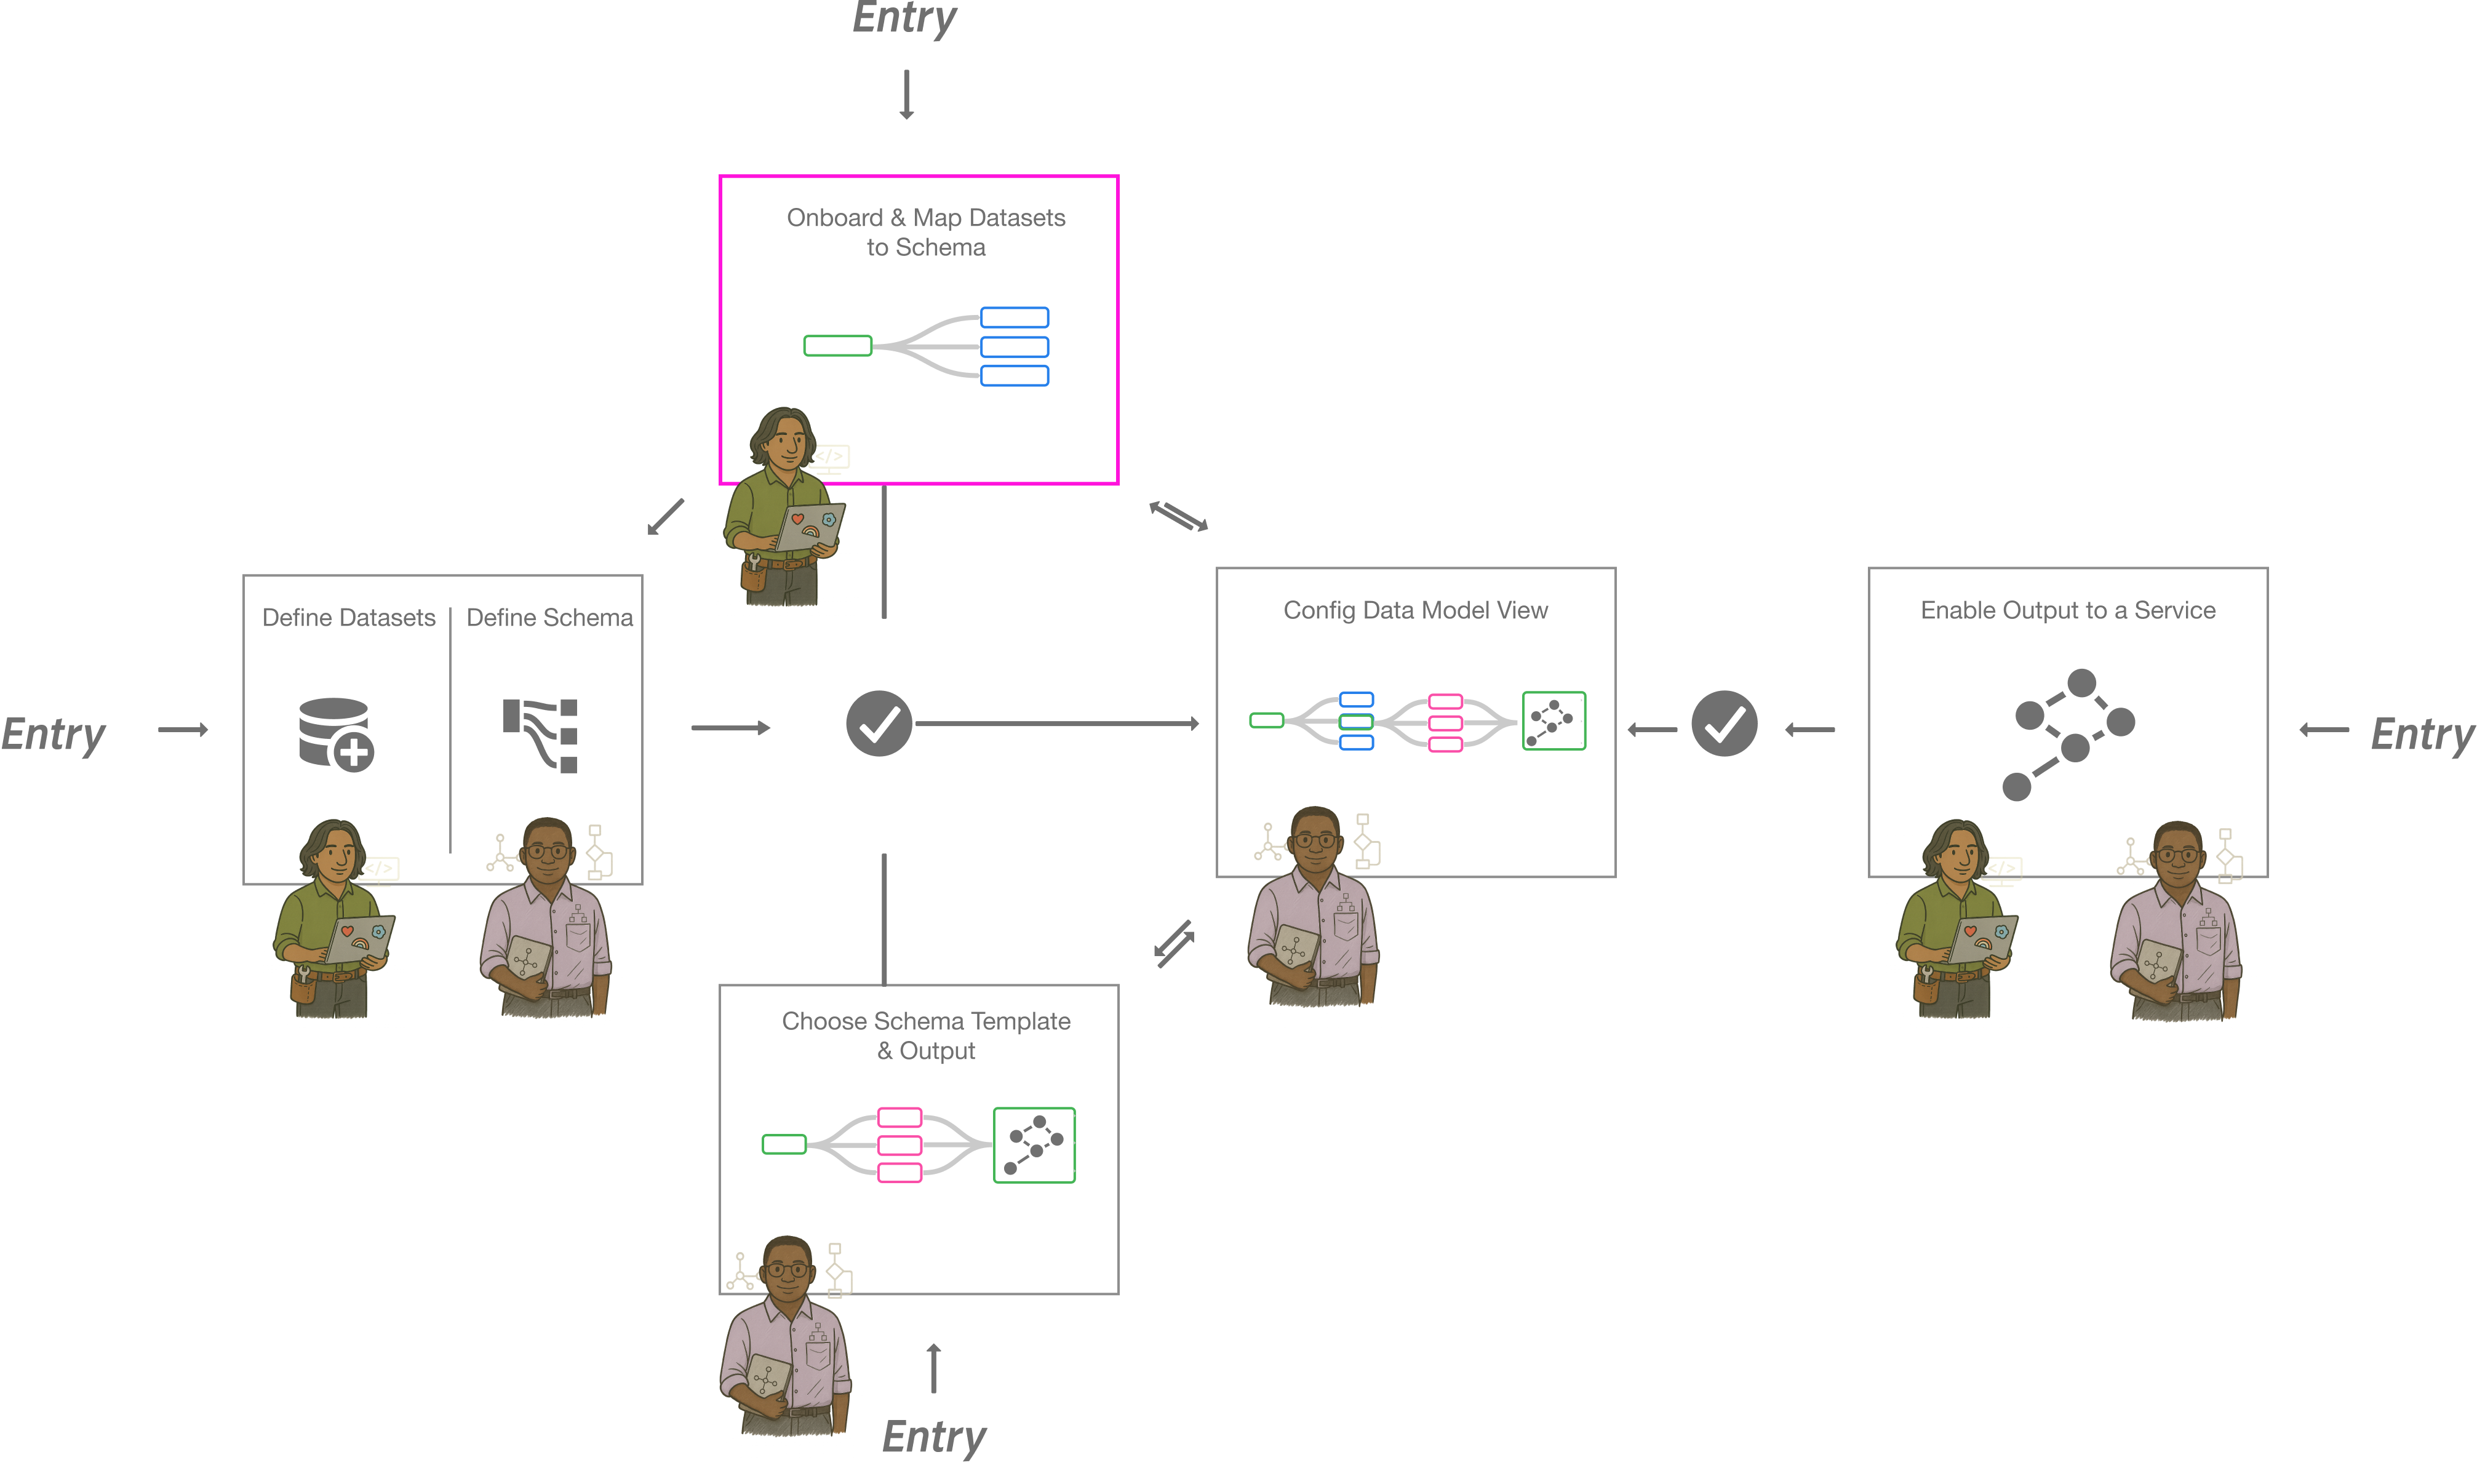
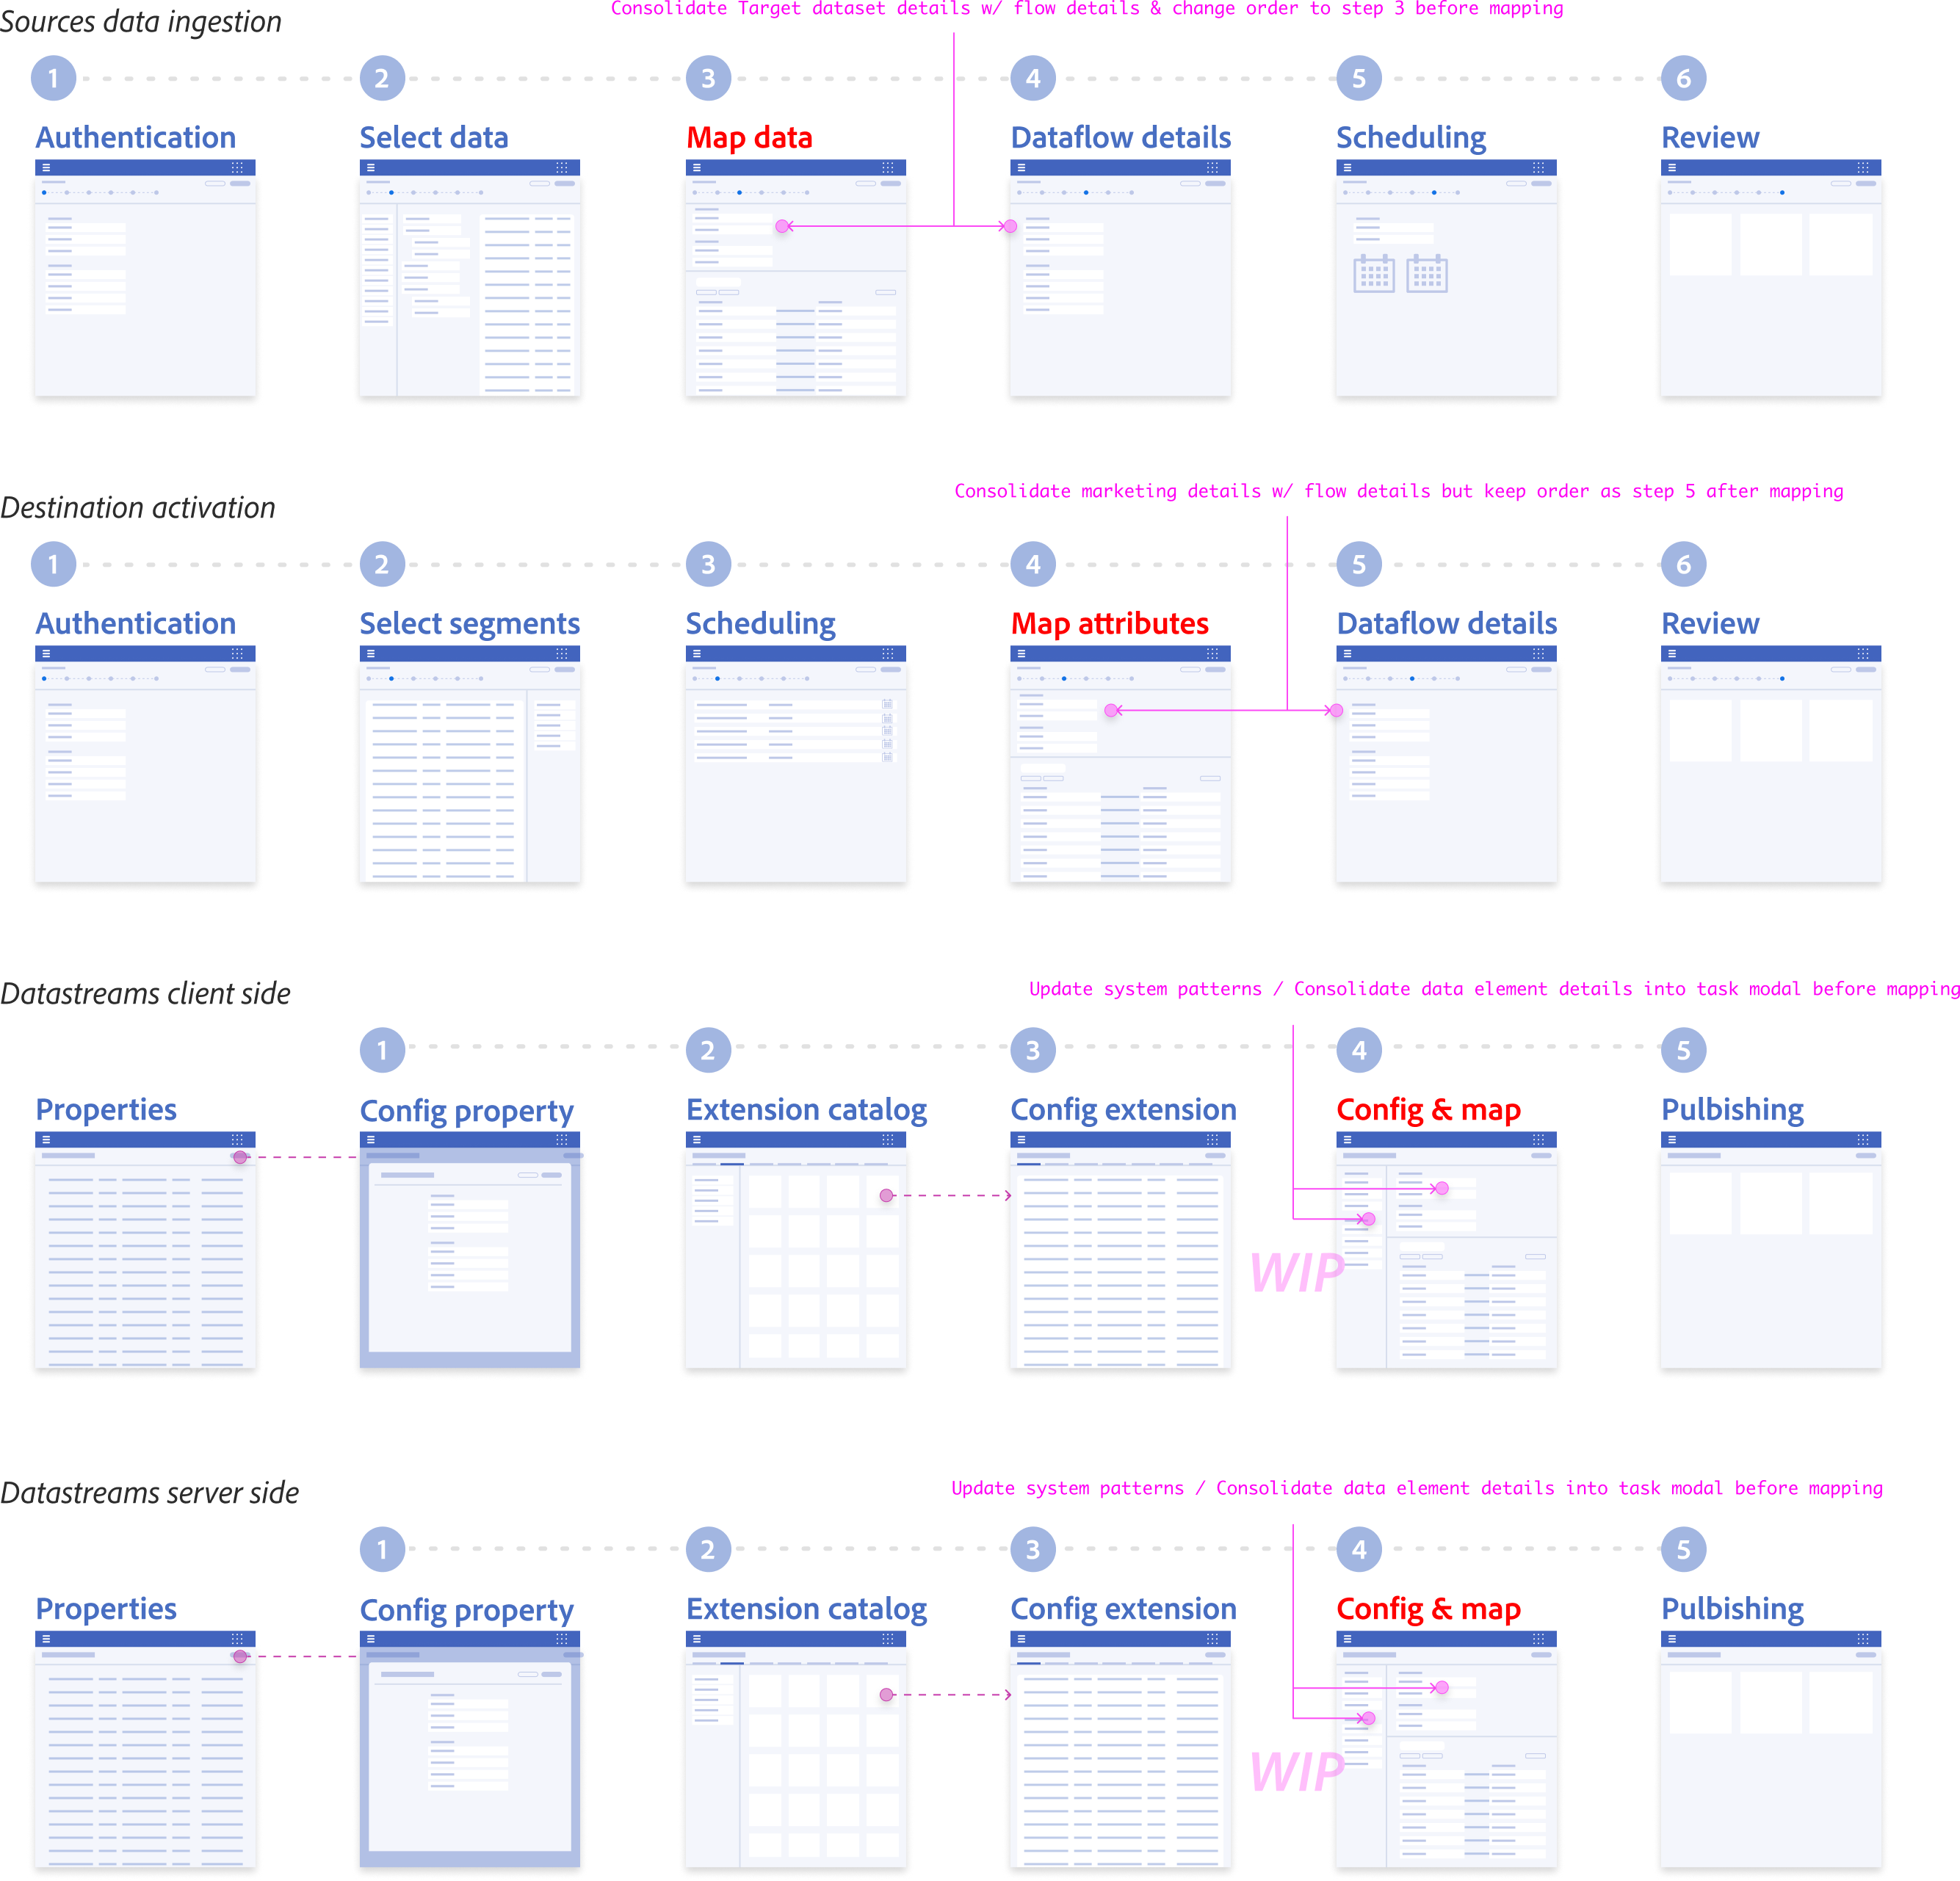
Ecosystem Mapping & Entry points
Before solving the mapping interface, we had to solve for the “Where”. Mapping isn’t a single-page task; it’s a utility that needs to exist across the Adobe ecosystem (Ingestion, Schema Editor, Profile). Instead of the bespoke page, I designed a Modular Service Component.
Cross-team Kick-off Workshop: Alignment on the “Handshake” lifecycle
During these sprints we focused on:
- Understanding the problem, and set our expected outcomes
- Worked through and understand technology dependencies
- Explored user goals and value statements
- Developed low-fi solutions (design and dev)
- Presented and validated with stakeholders and customers


Macro-level Entry Point Diagram
How this “handshake” plugs into different Adobe Experience Cloud apps
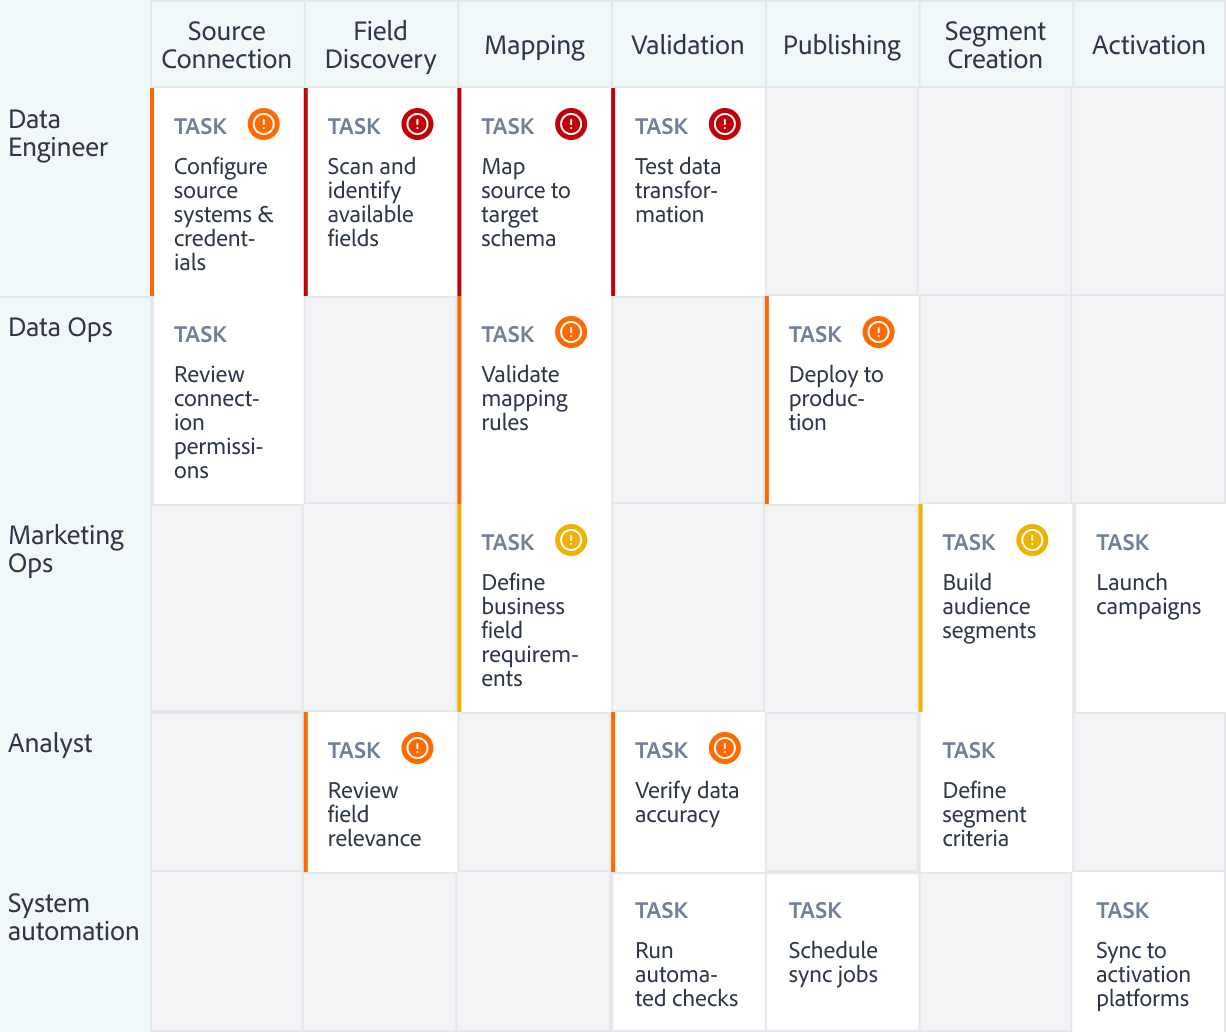
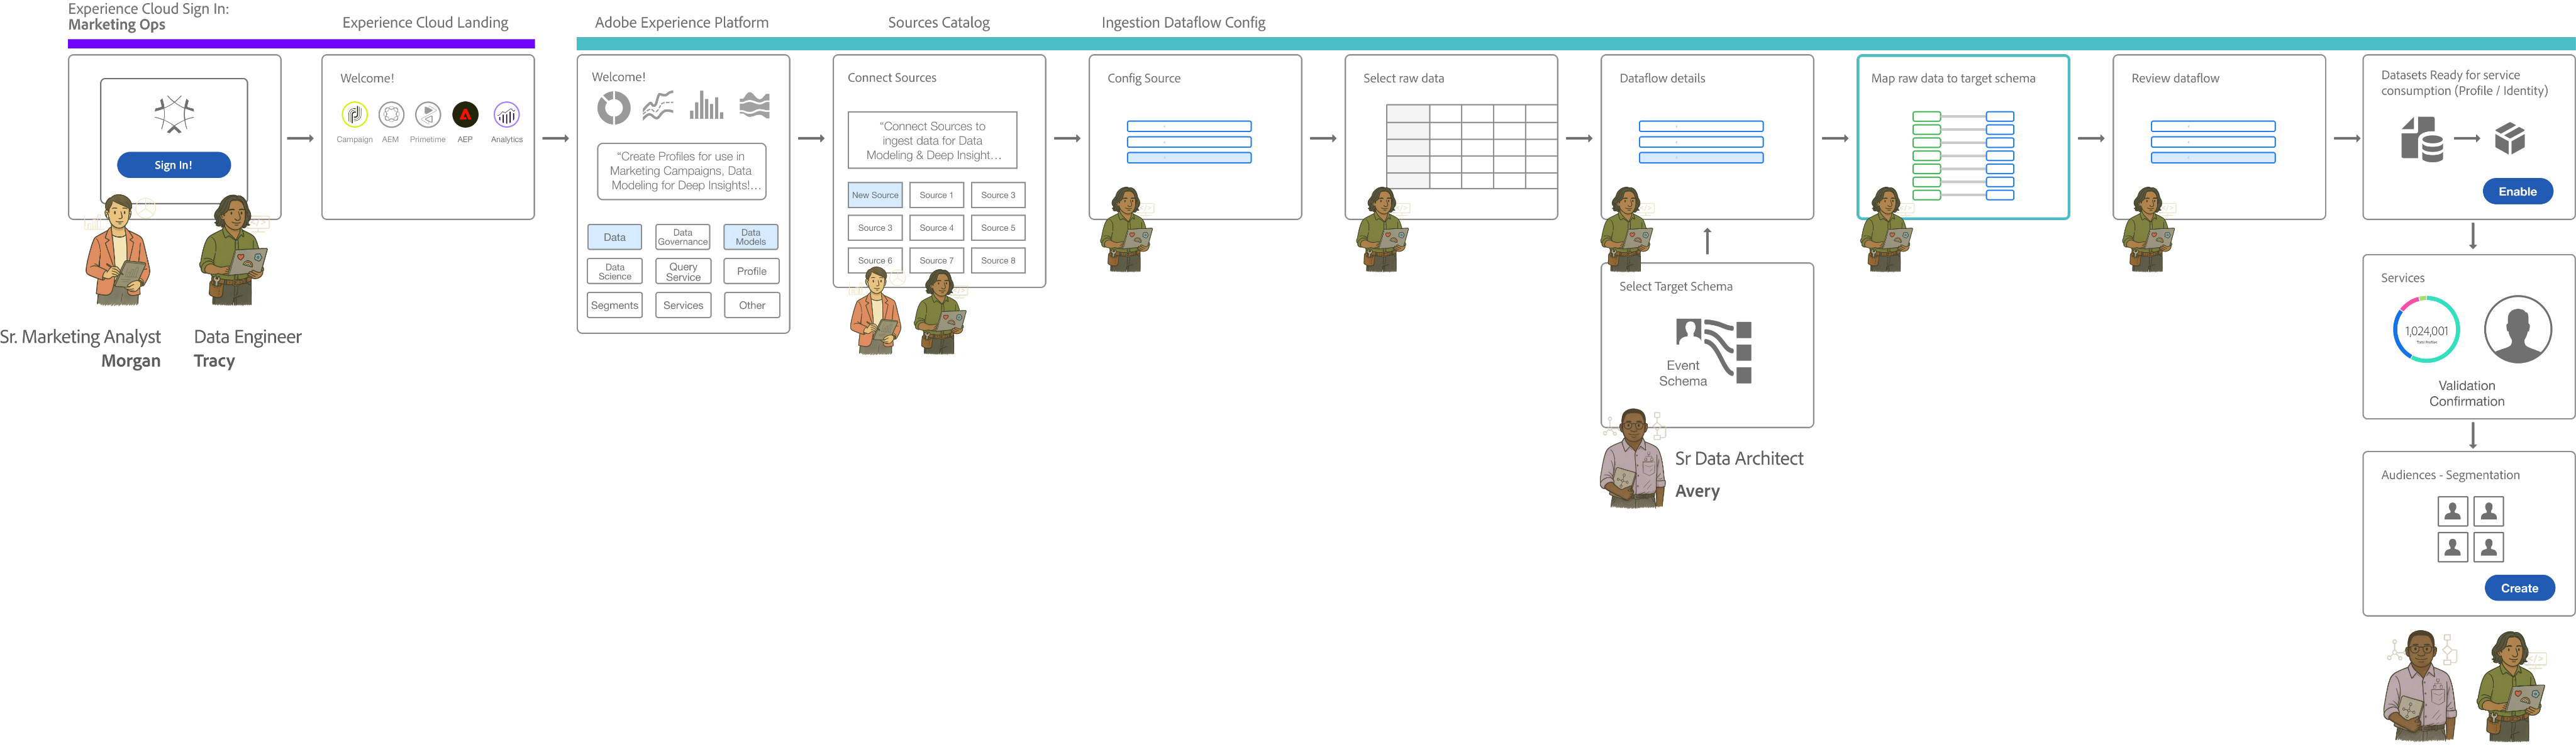
Data Ingestion Workflow: Cross-Functional Orchestration
Where Marketing Ops, Data Engineers, and Data Architects intersect
The ‘Handshake’ occurs at the critical juncture between Selecting Raw Data Mapping and Dataflow Review.
Workflow recommendations
Reduced steps within workflows and unified design system patterns
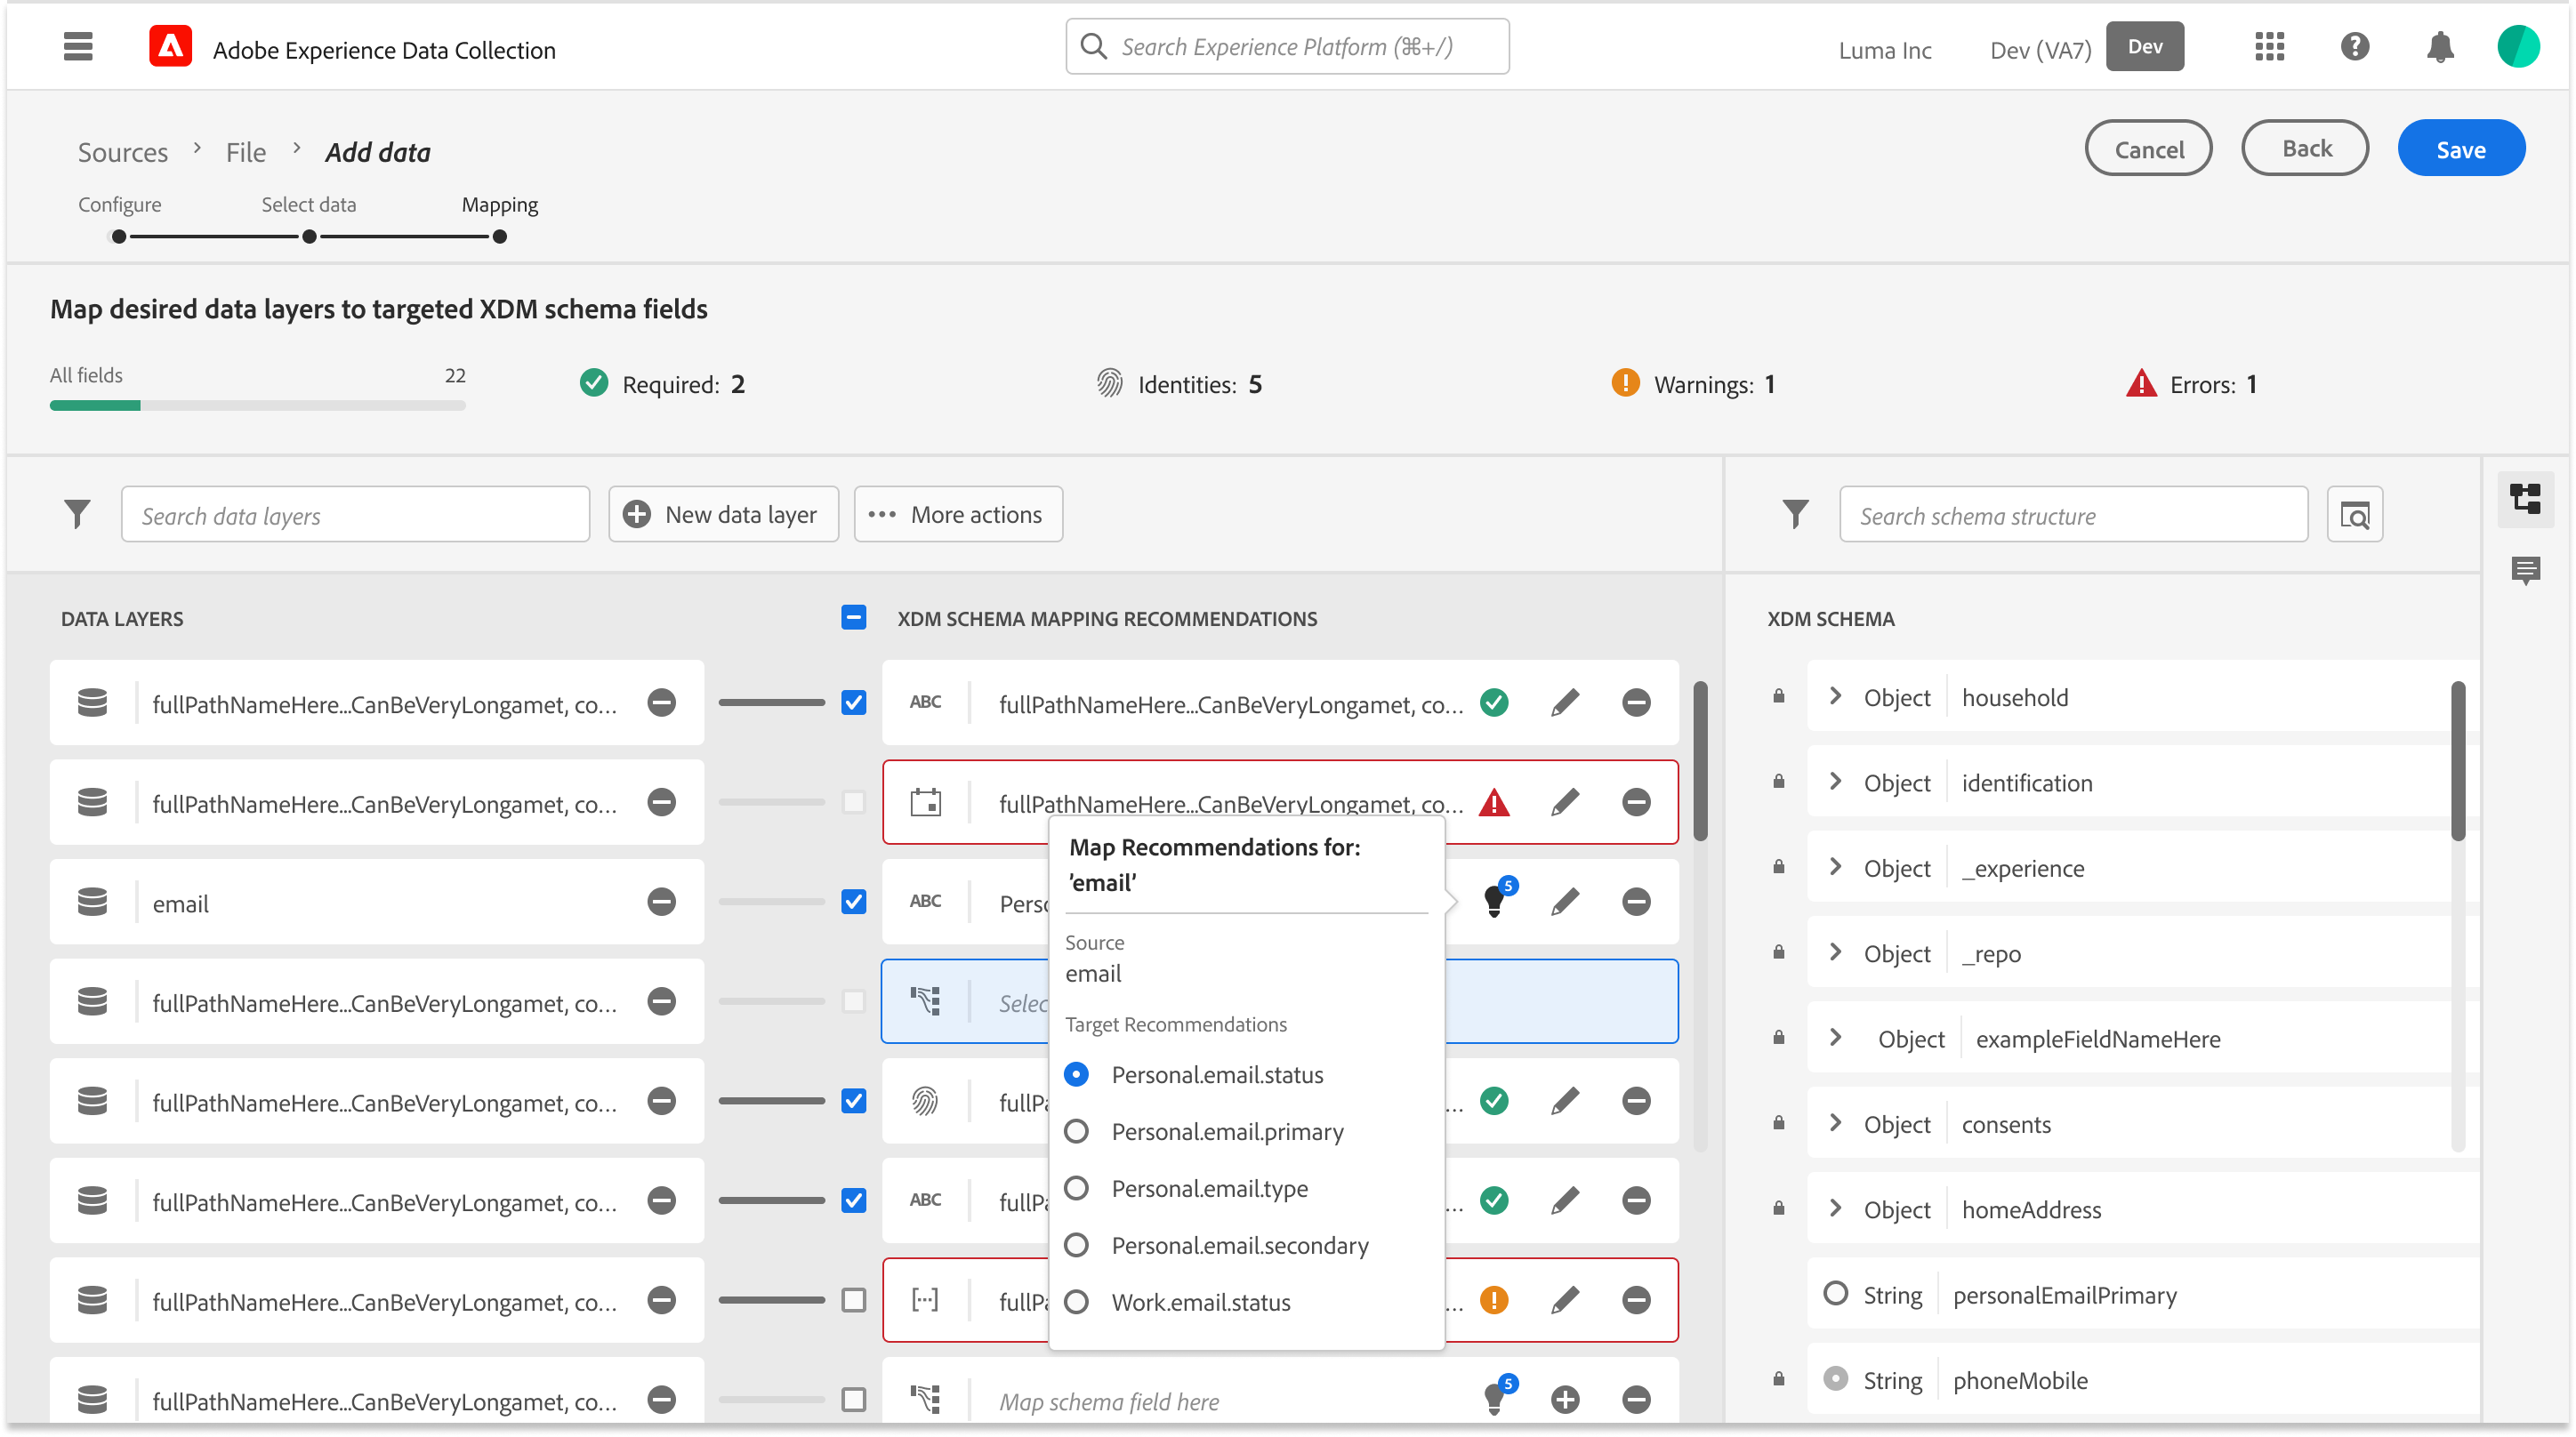
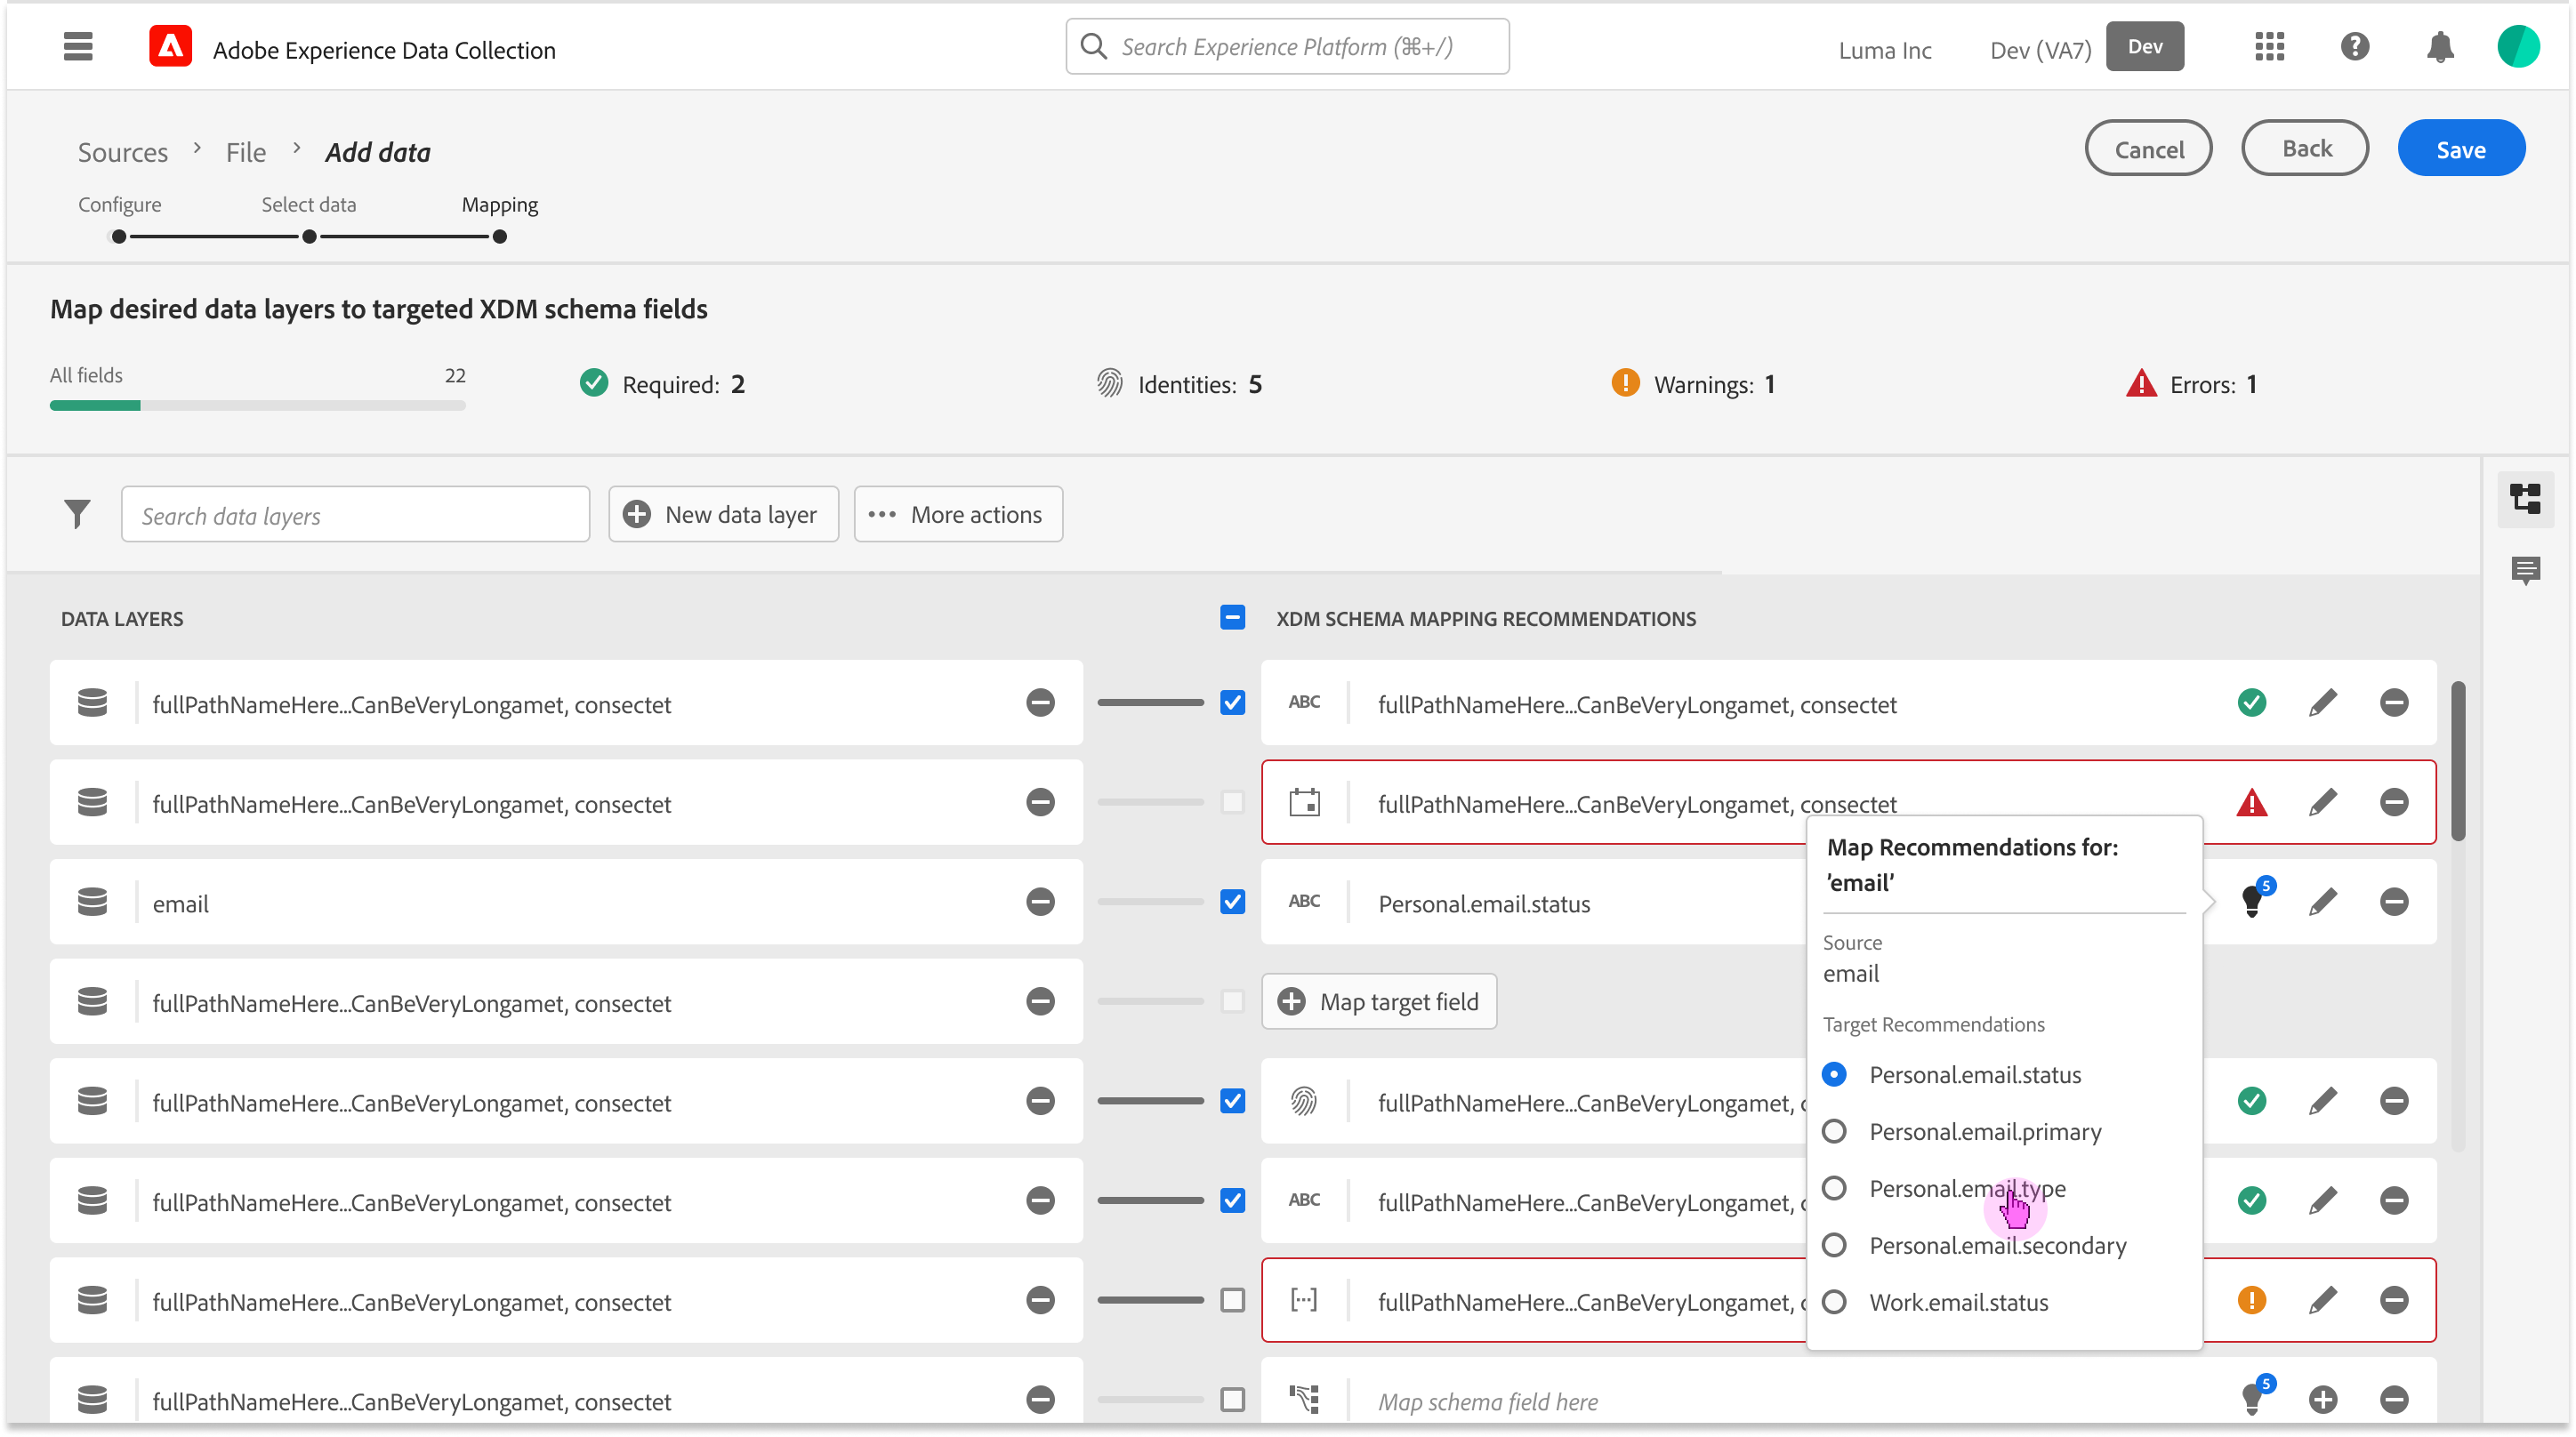
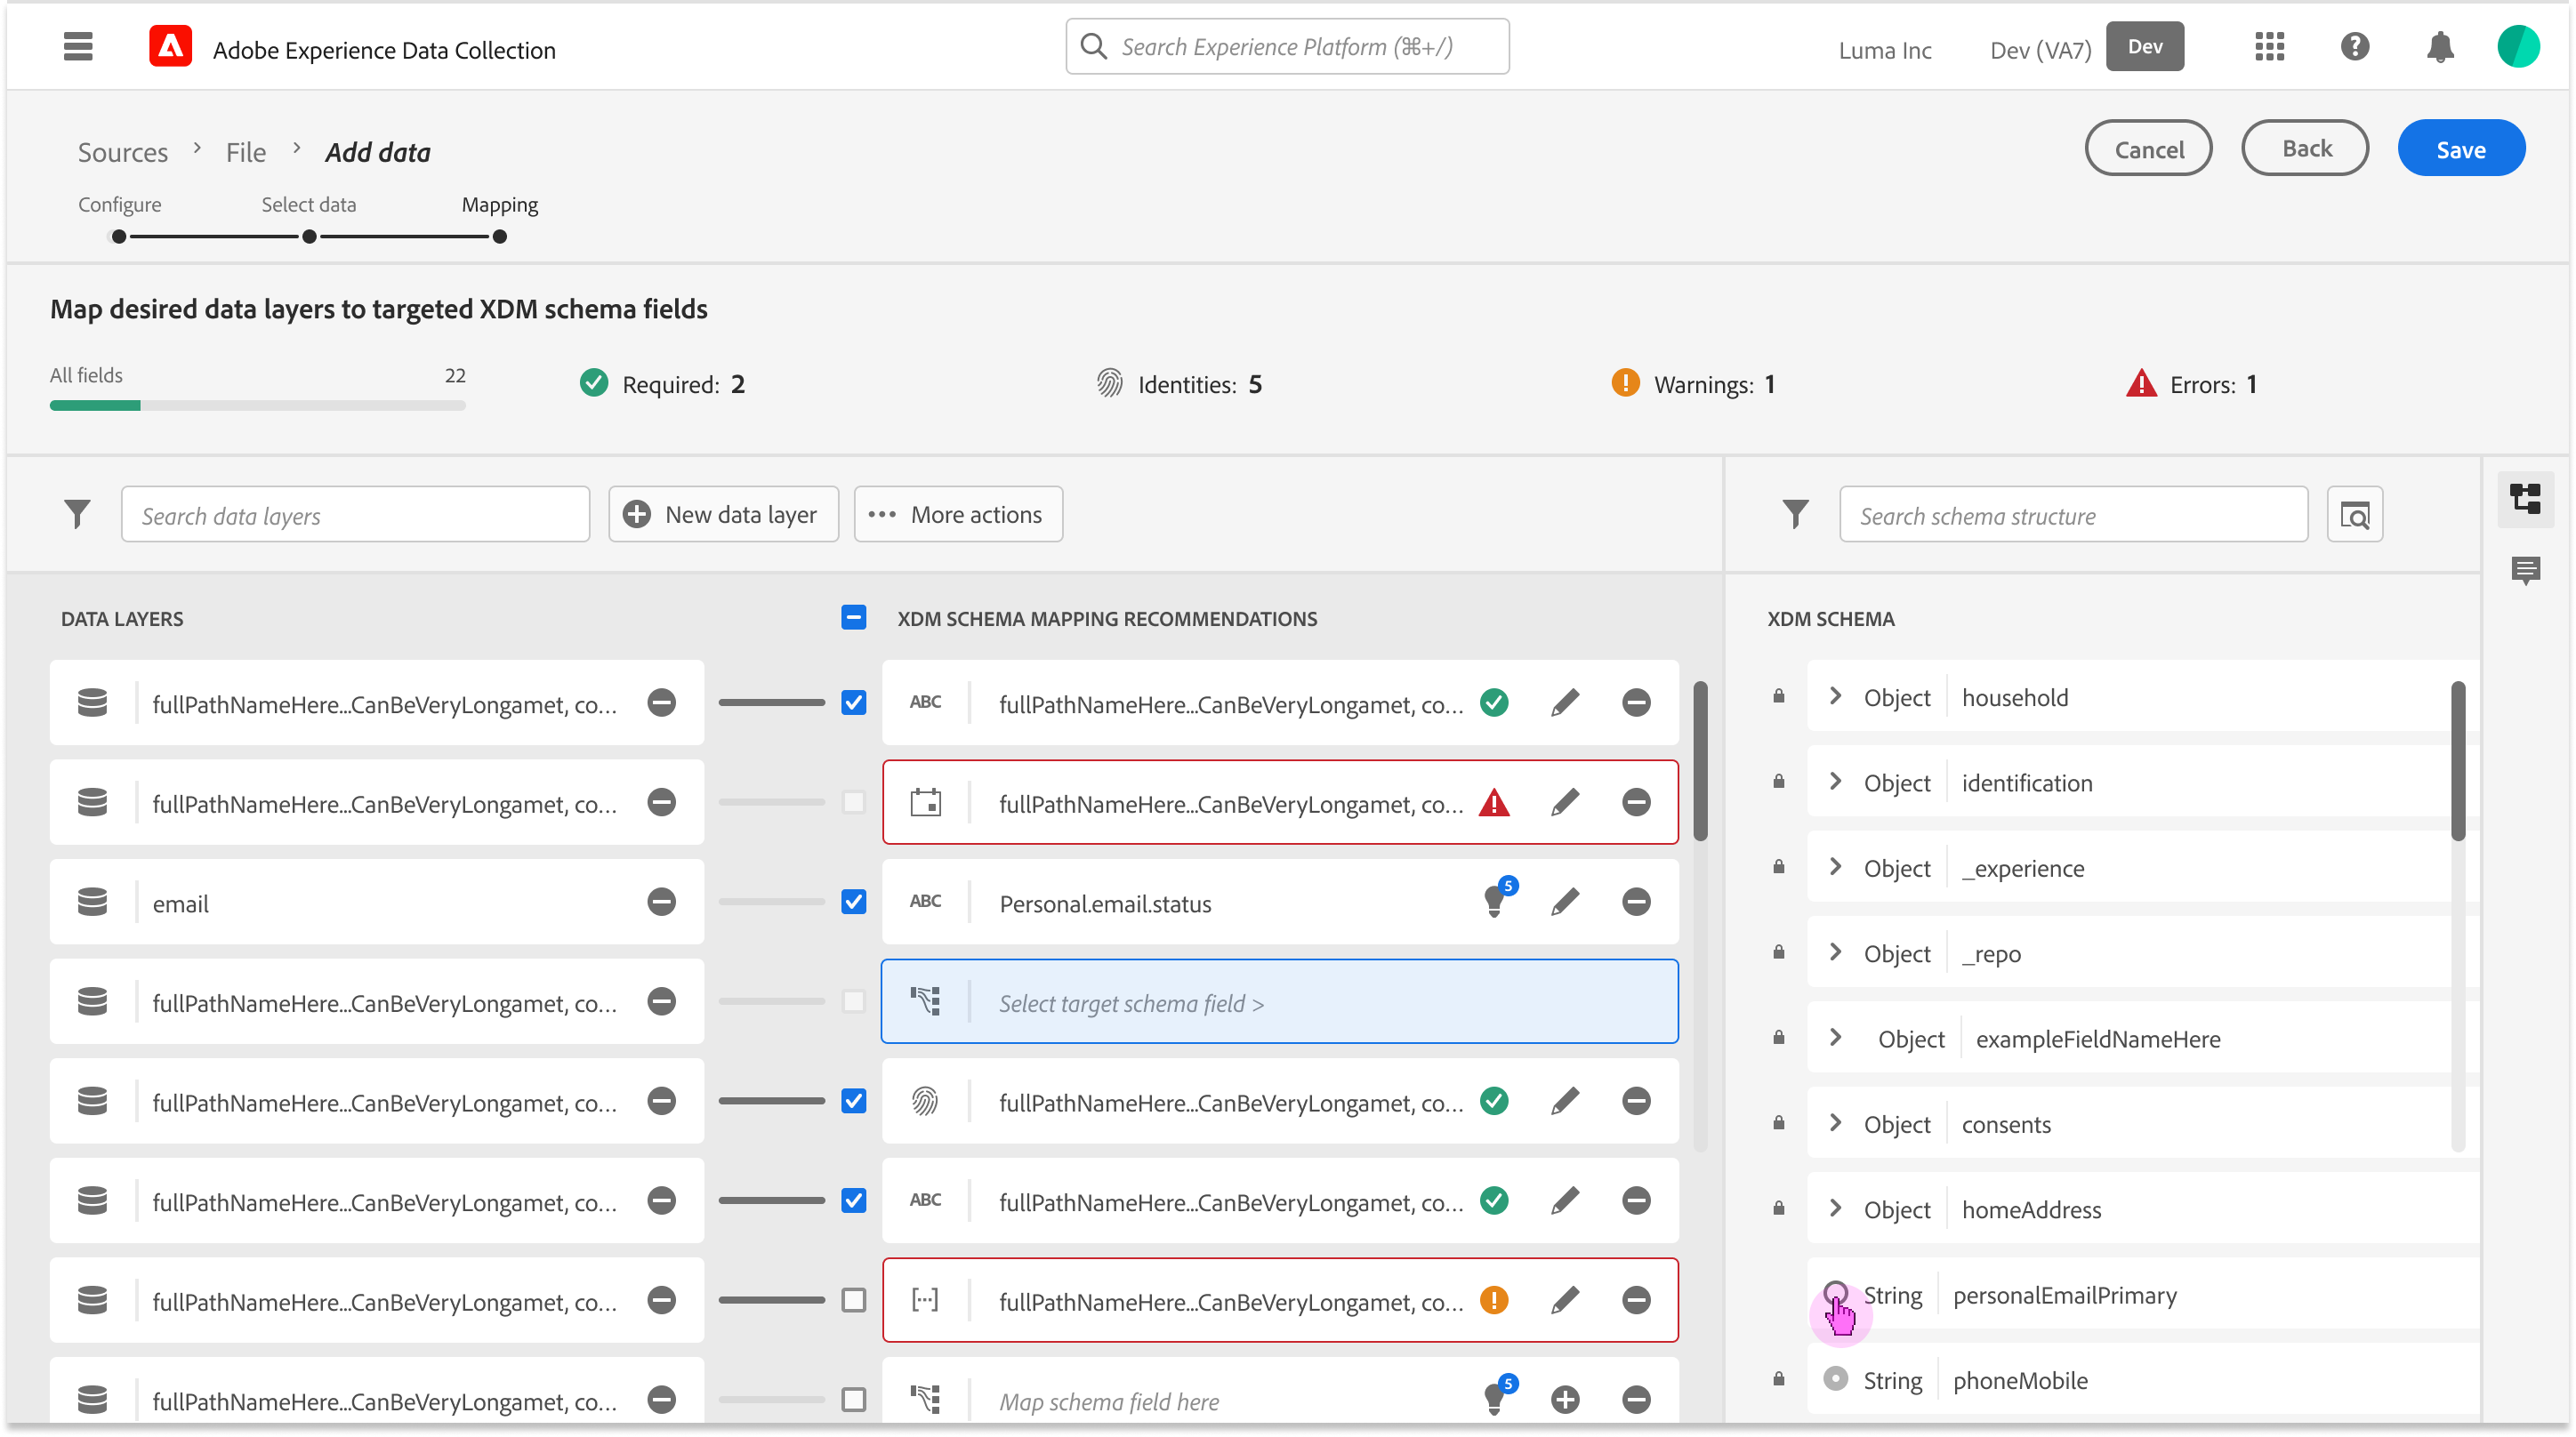
Defining the Handshake Grammar (Anatomy & Specs)
Standardizing the communication between the Architect and the Machine. Raw metadata (Sources) and standardized XDM (Target Schema) speak different languages.
Users were confused by mismatched datatypes. To establish a Metadata-First Visual Grammar I aligned the UI with Adobe’s “Spectrum” design system but added specific specs for AI-confidence and data-origin metadata.
Patterns and Guiding Principles
Identified important questions to keep in mind during exploration
- How might we remind users why we are normalizing the data?
- How do we make sure our solutions are performance based?
- How might the user expect to approach the tools?
- How can we reduce redundancies?
Spectrum Design System Guidelines
(*Reference guide for all Adobe Cloud Editors)
Anatomy
Metadata transparency and system alignment
Behavioral Design
State management and the 5-second latency solution
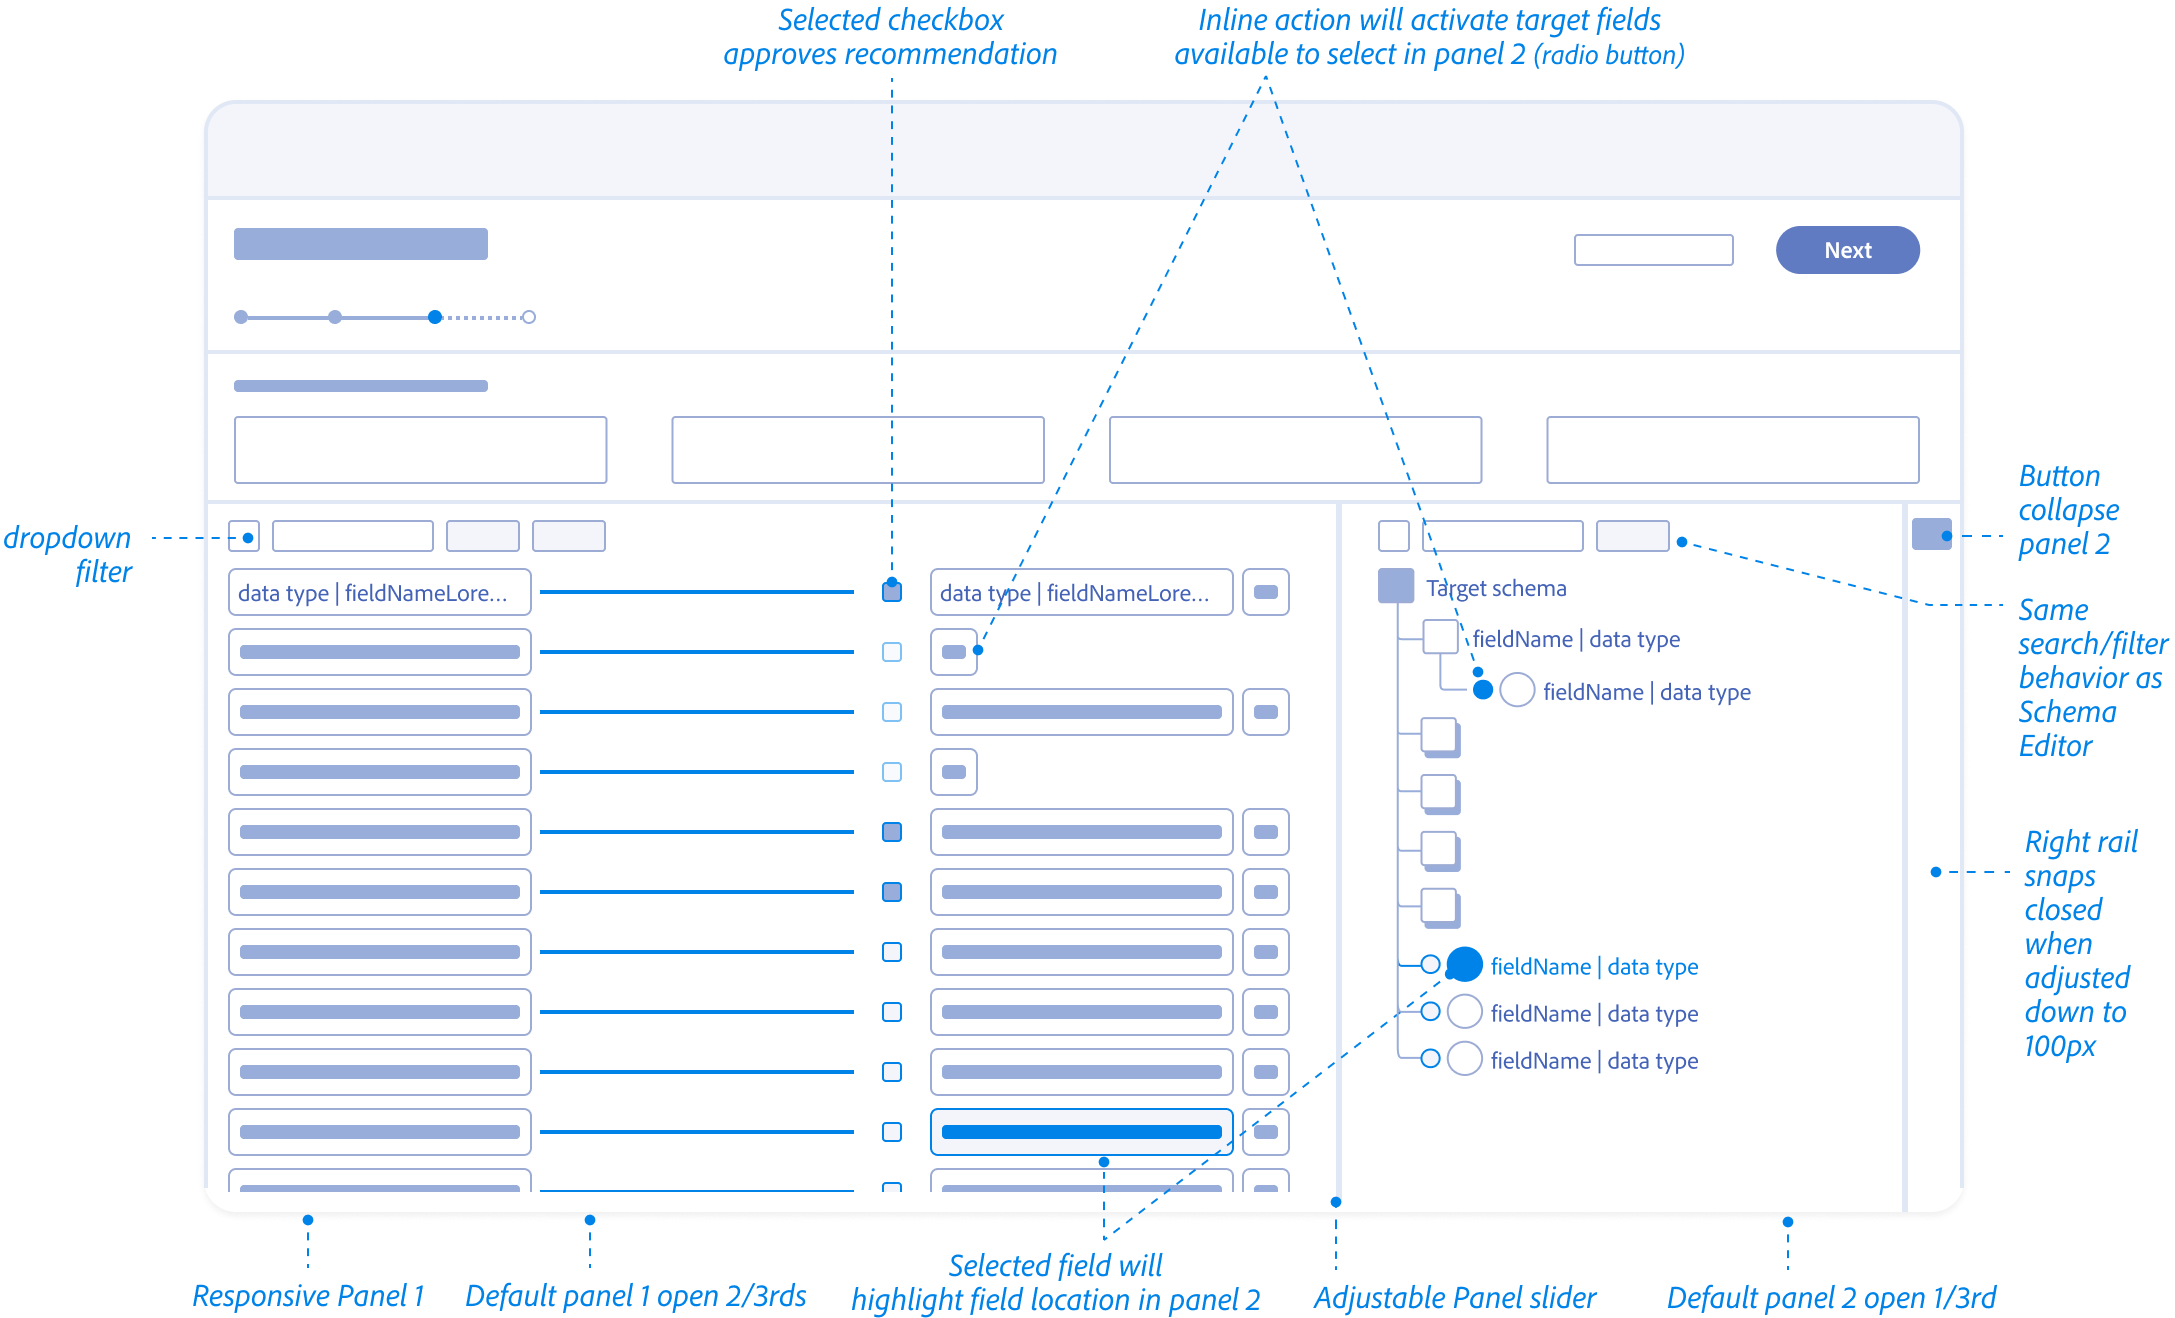
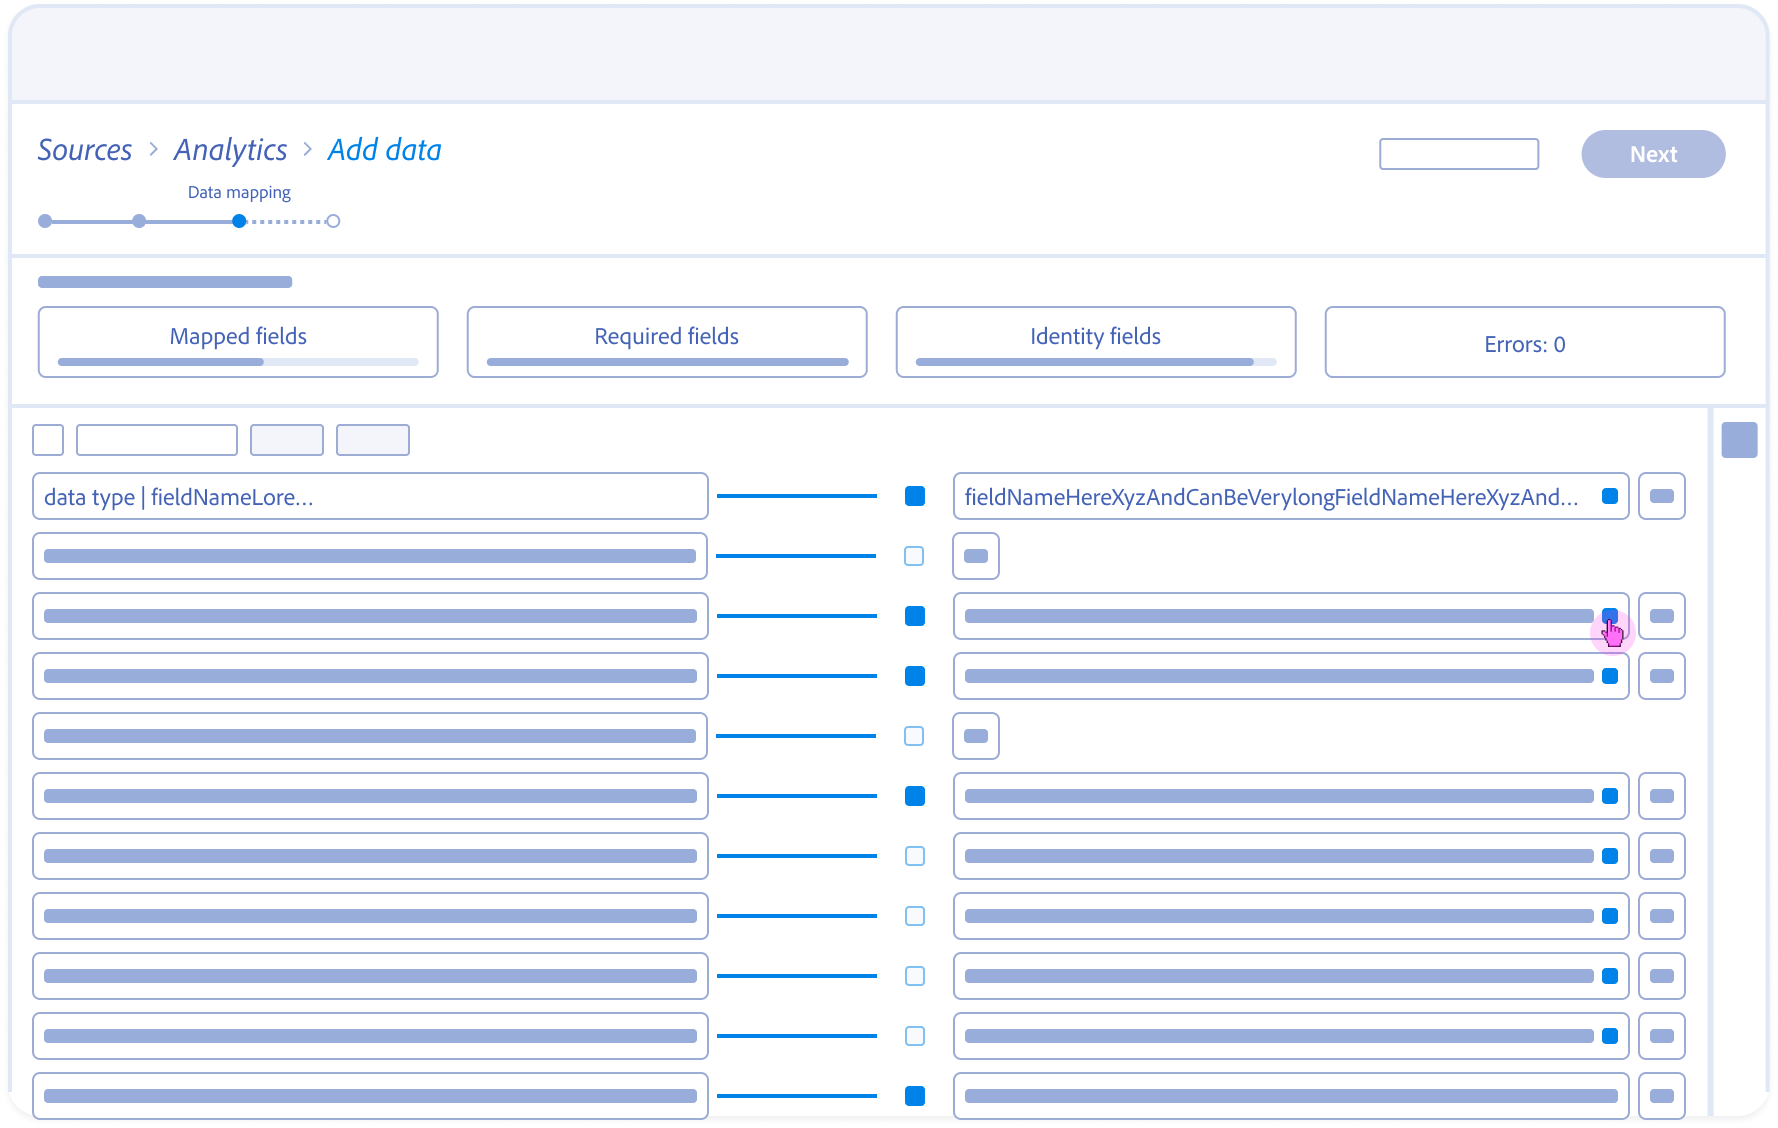
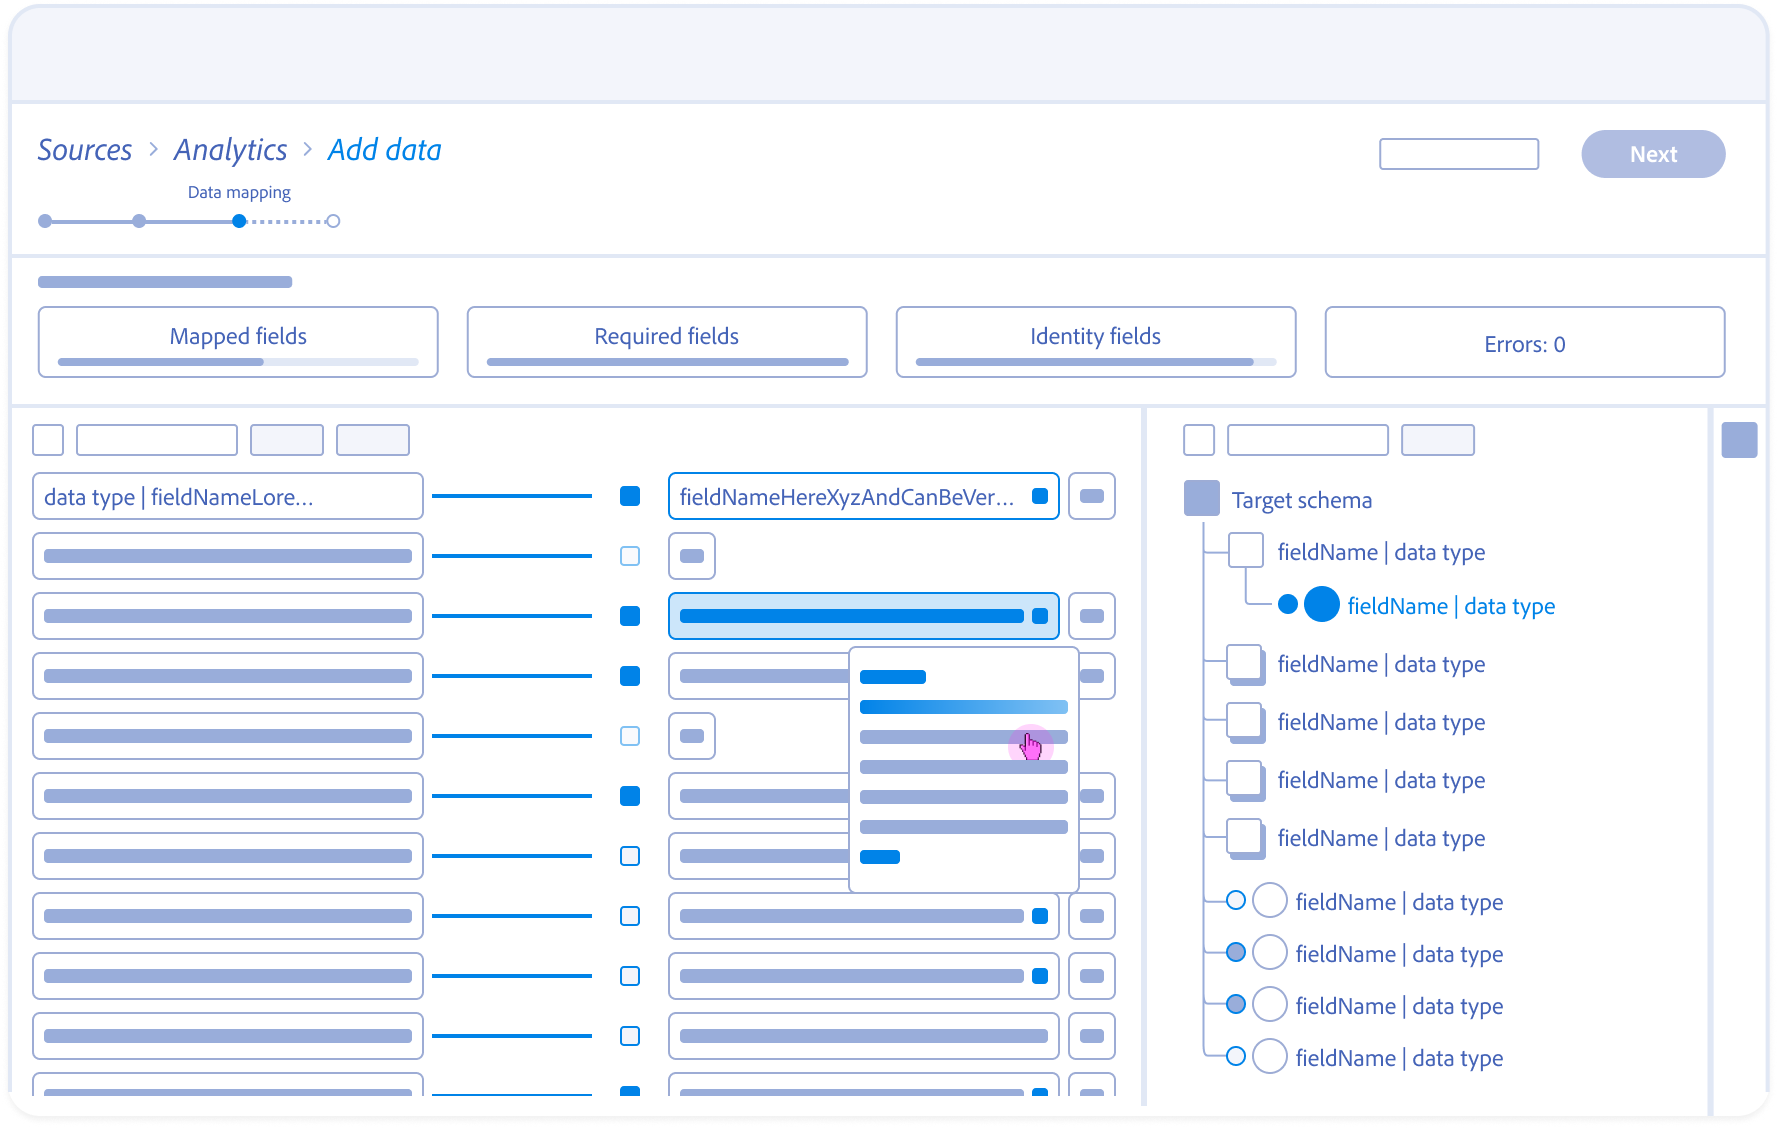
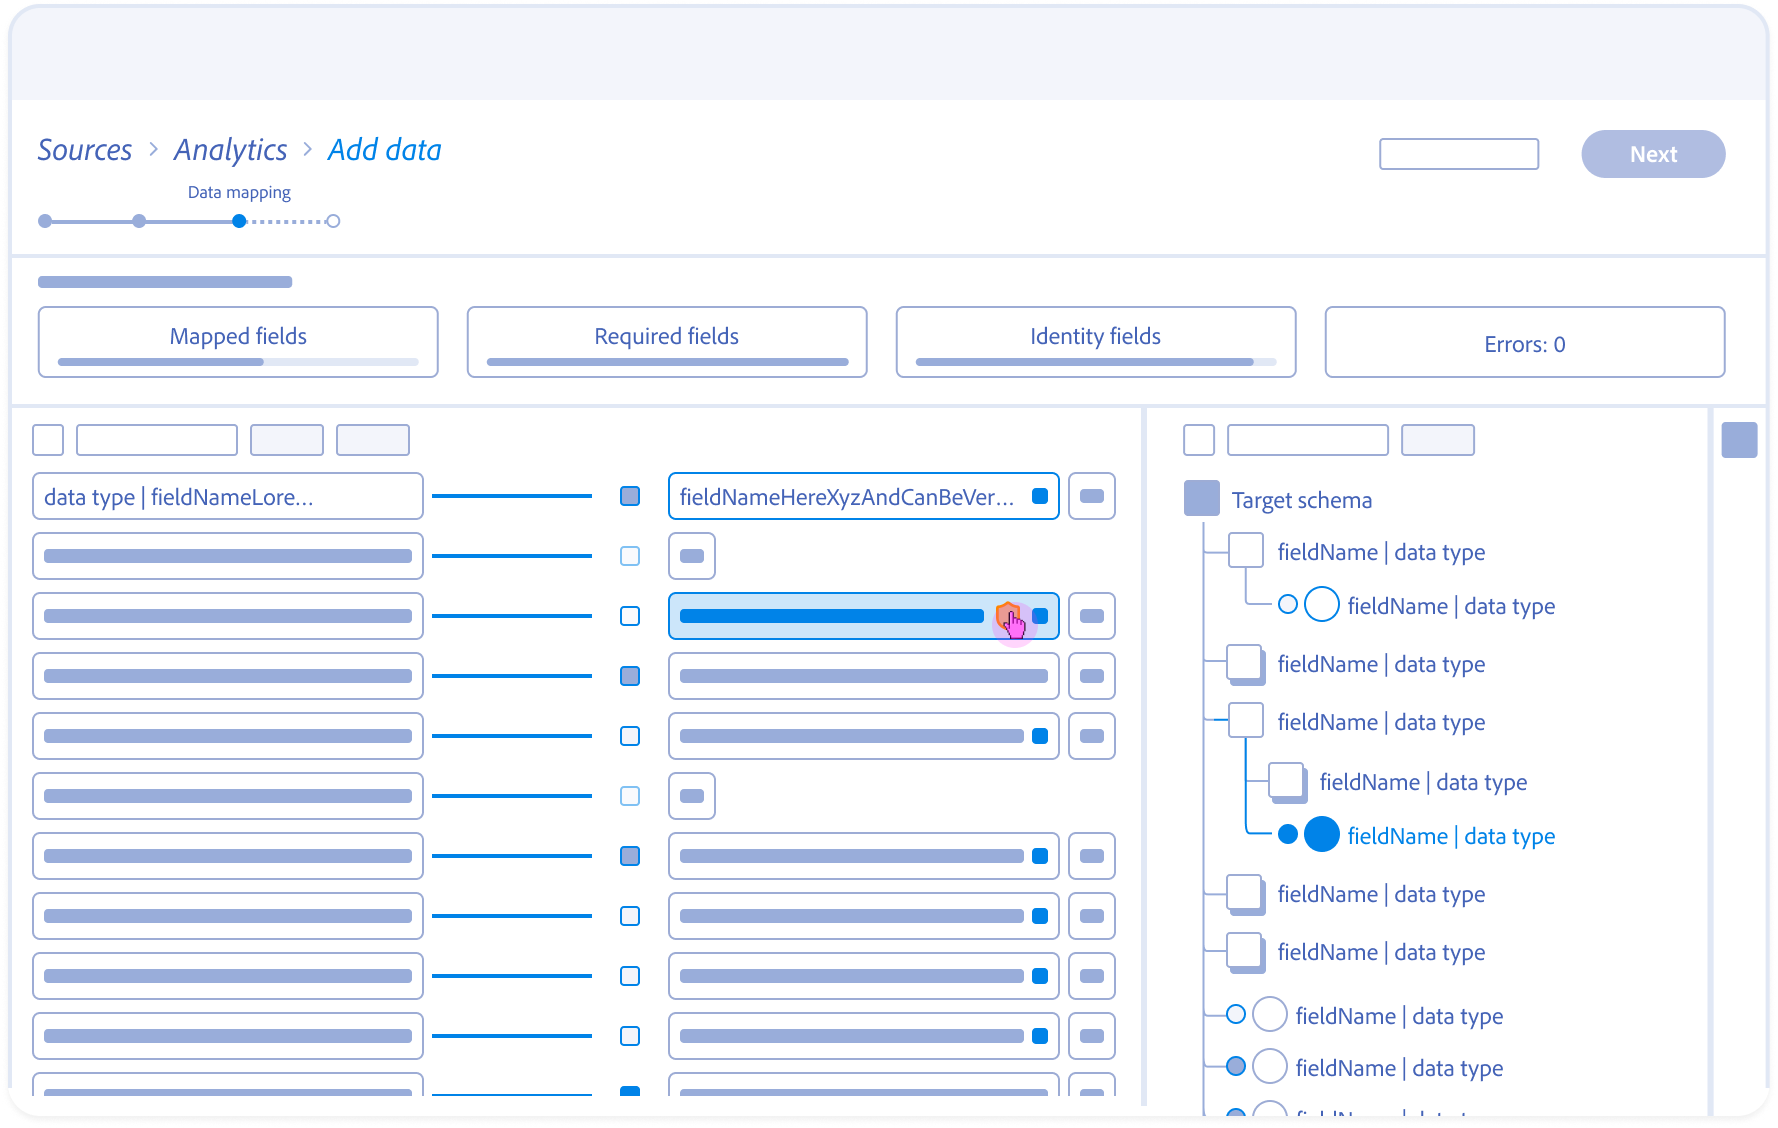
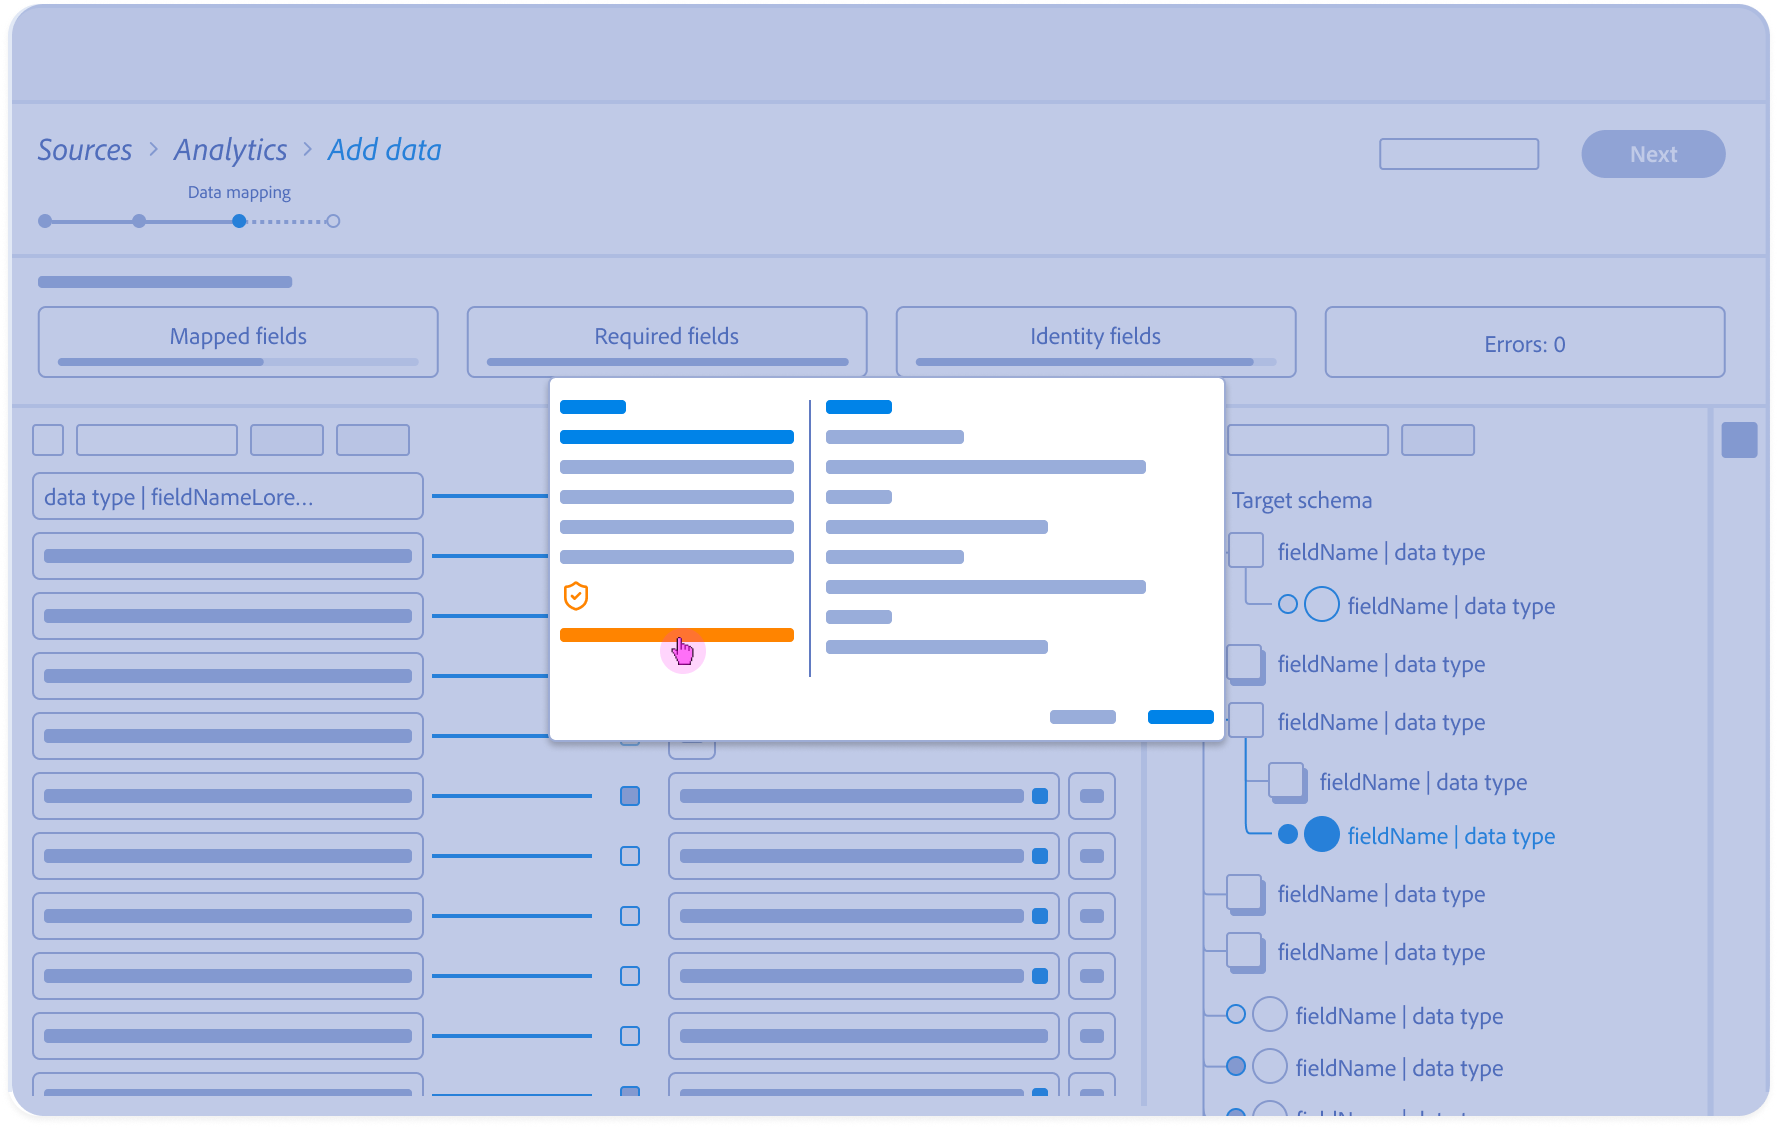
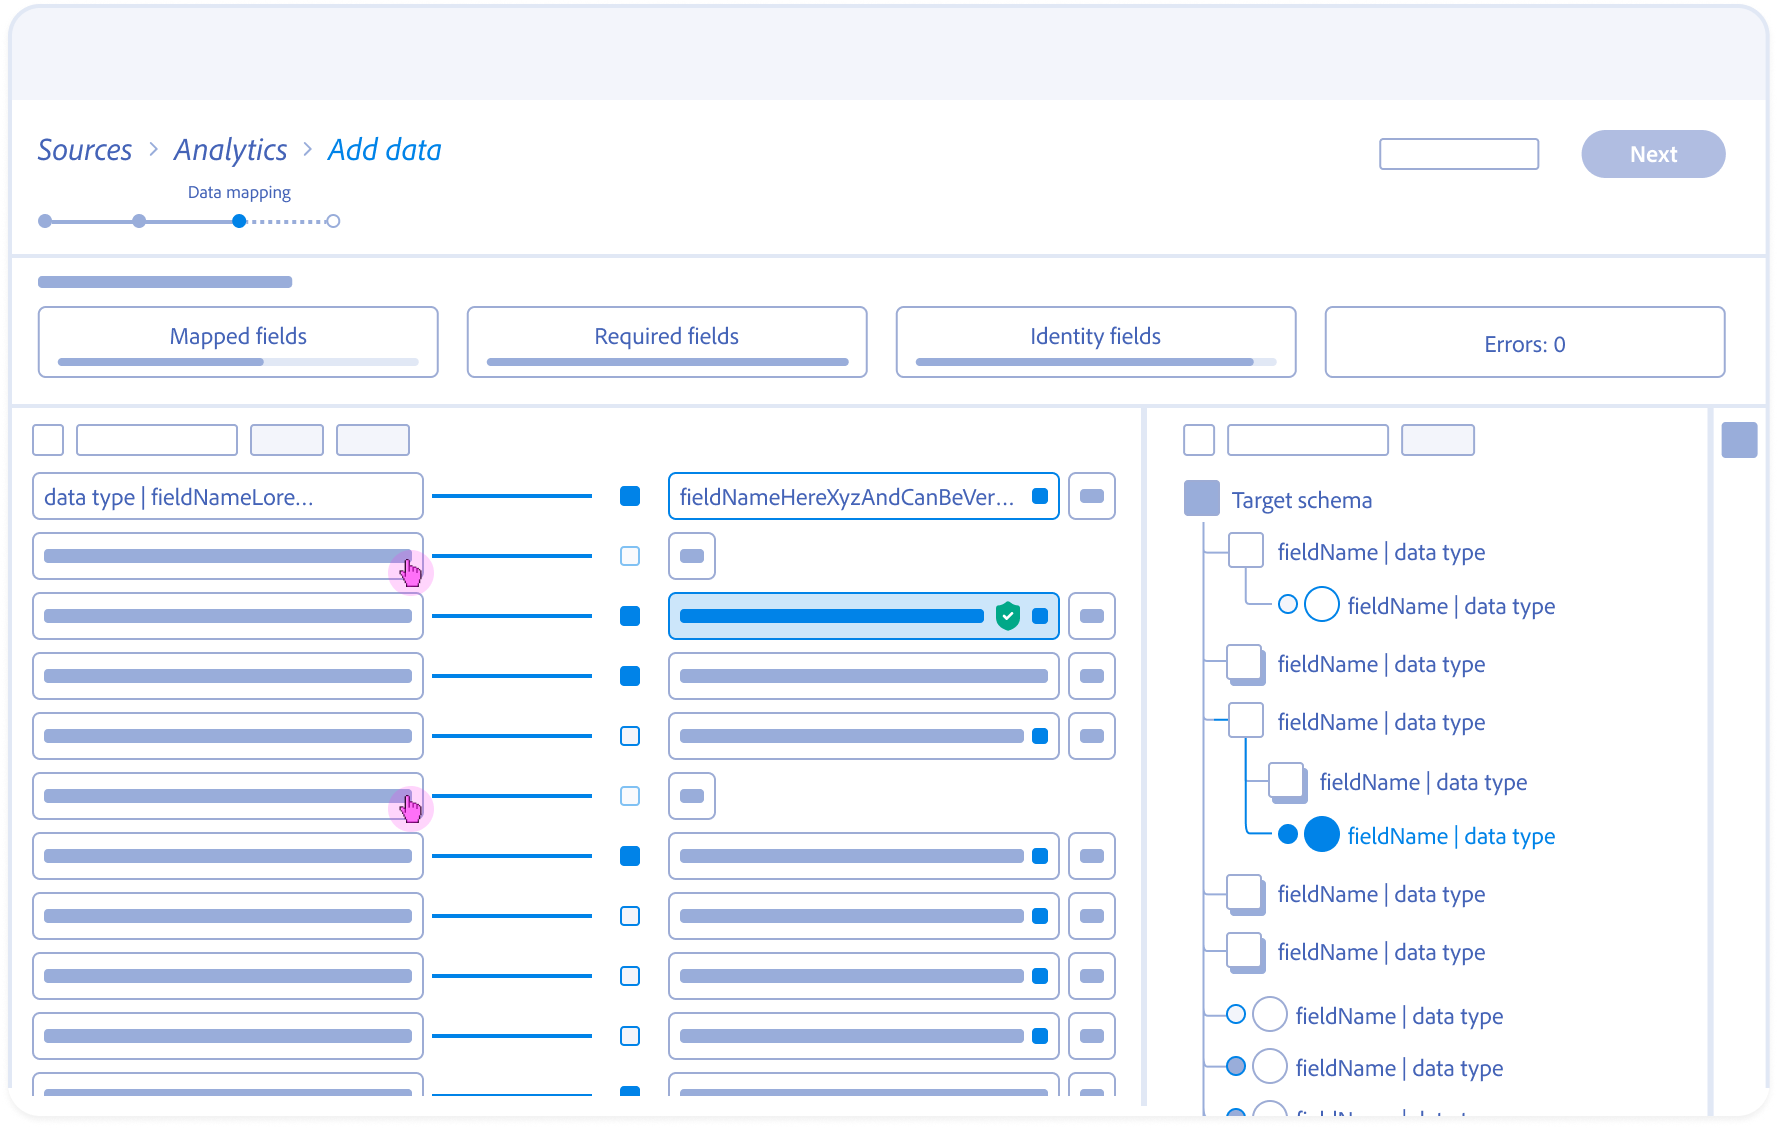
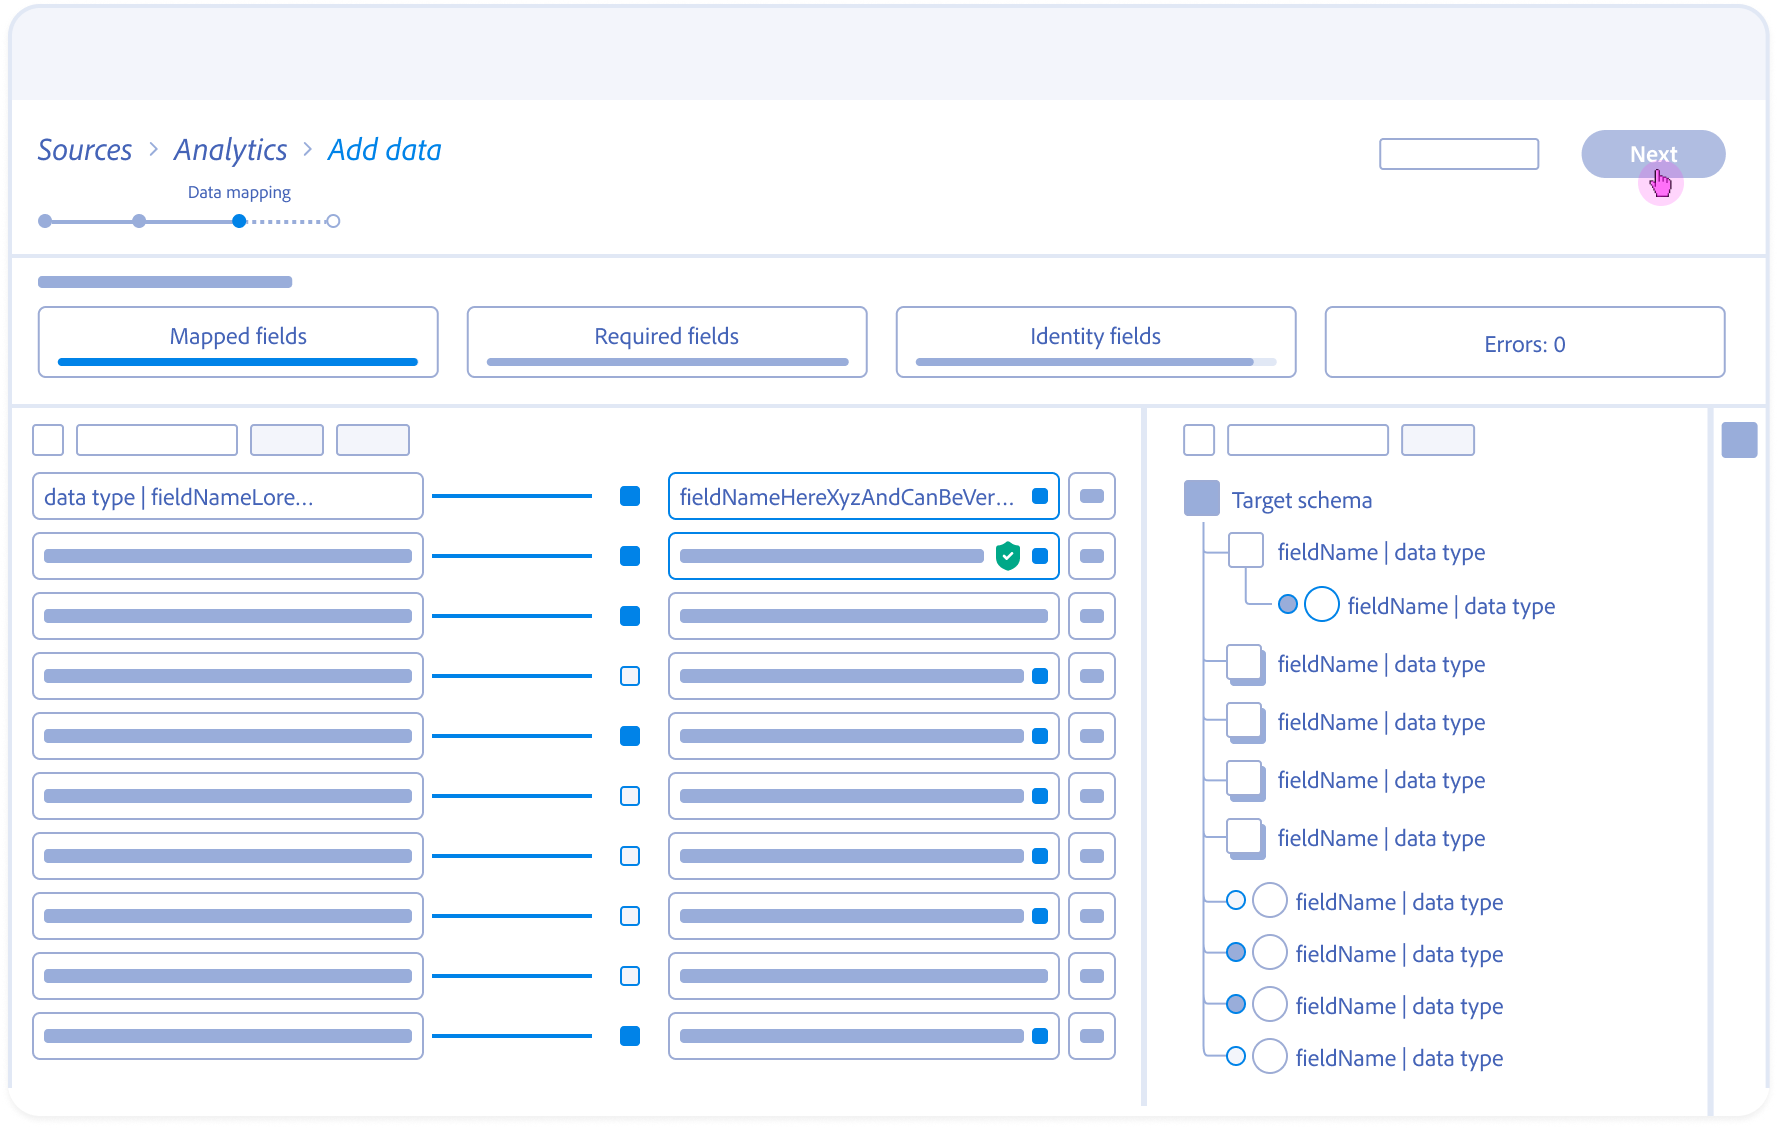
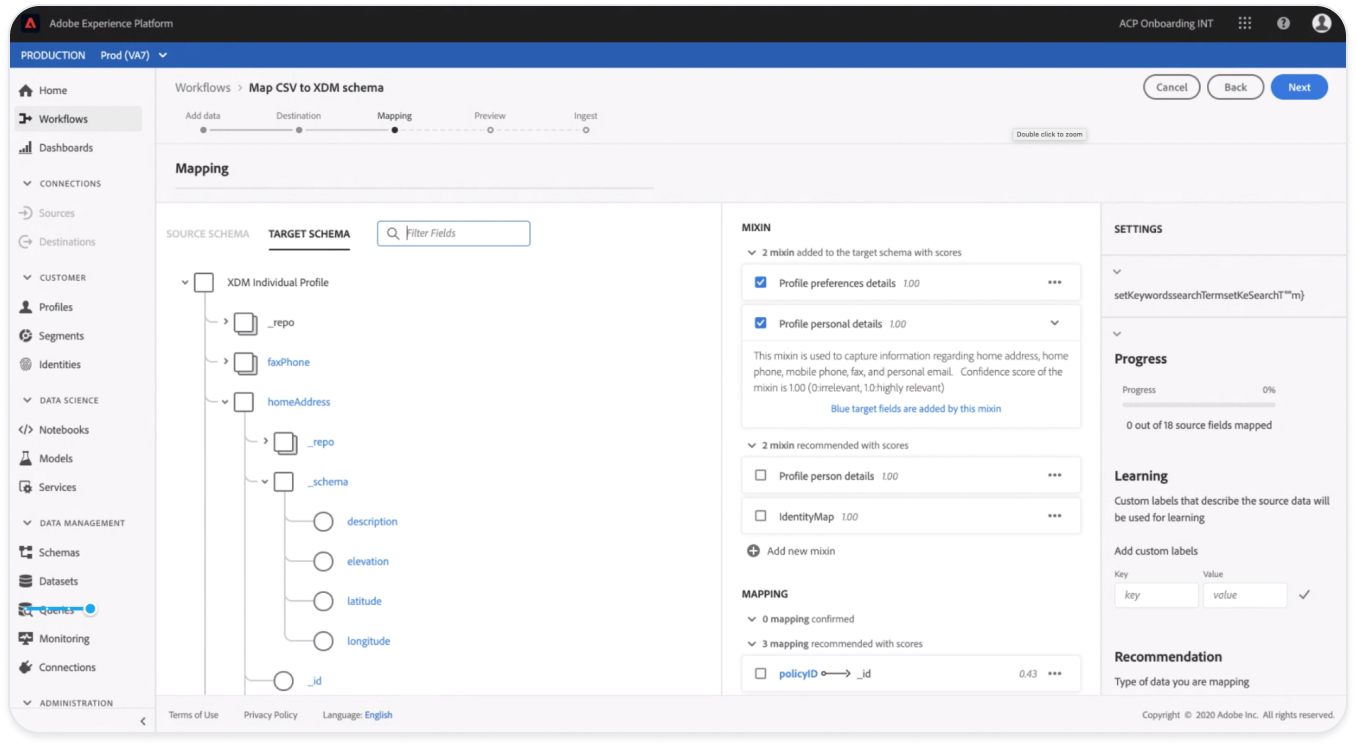
Mapping Fields Anatomy
Navigating the 5-second Gap
Initial Engineering prototypes confirmed the 5-second server-side delay. A standard loading spinner created a “Momentum Gap” that frustrated power users.
Users were confused by mismatched datatypes. To establish a Metadata-First Visual Grammar I aligned the UI with Adobe’s “Spectrum” design system but added specific specs for AI-confidence and data-origin metadata.
Rapid prototyping w/ Engineering
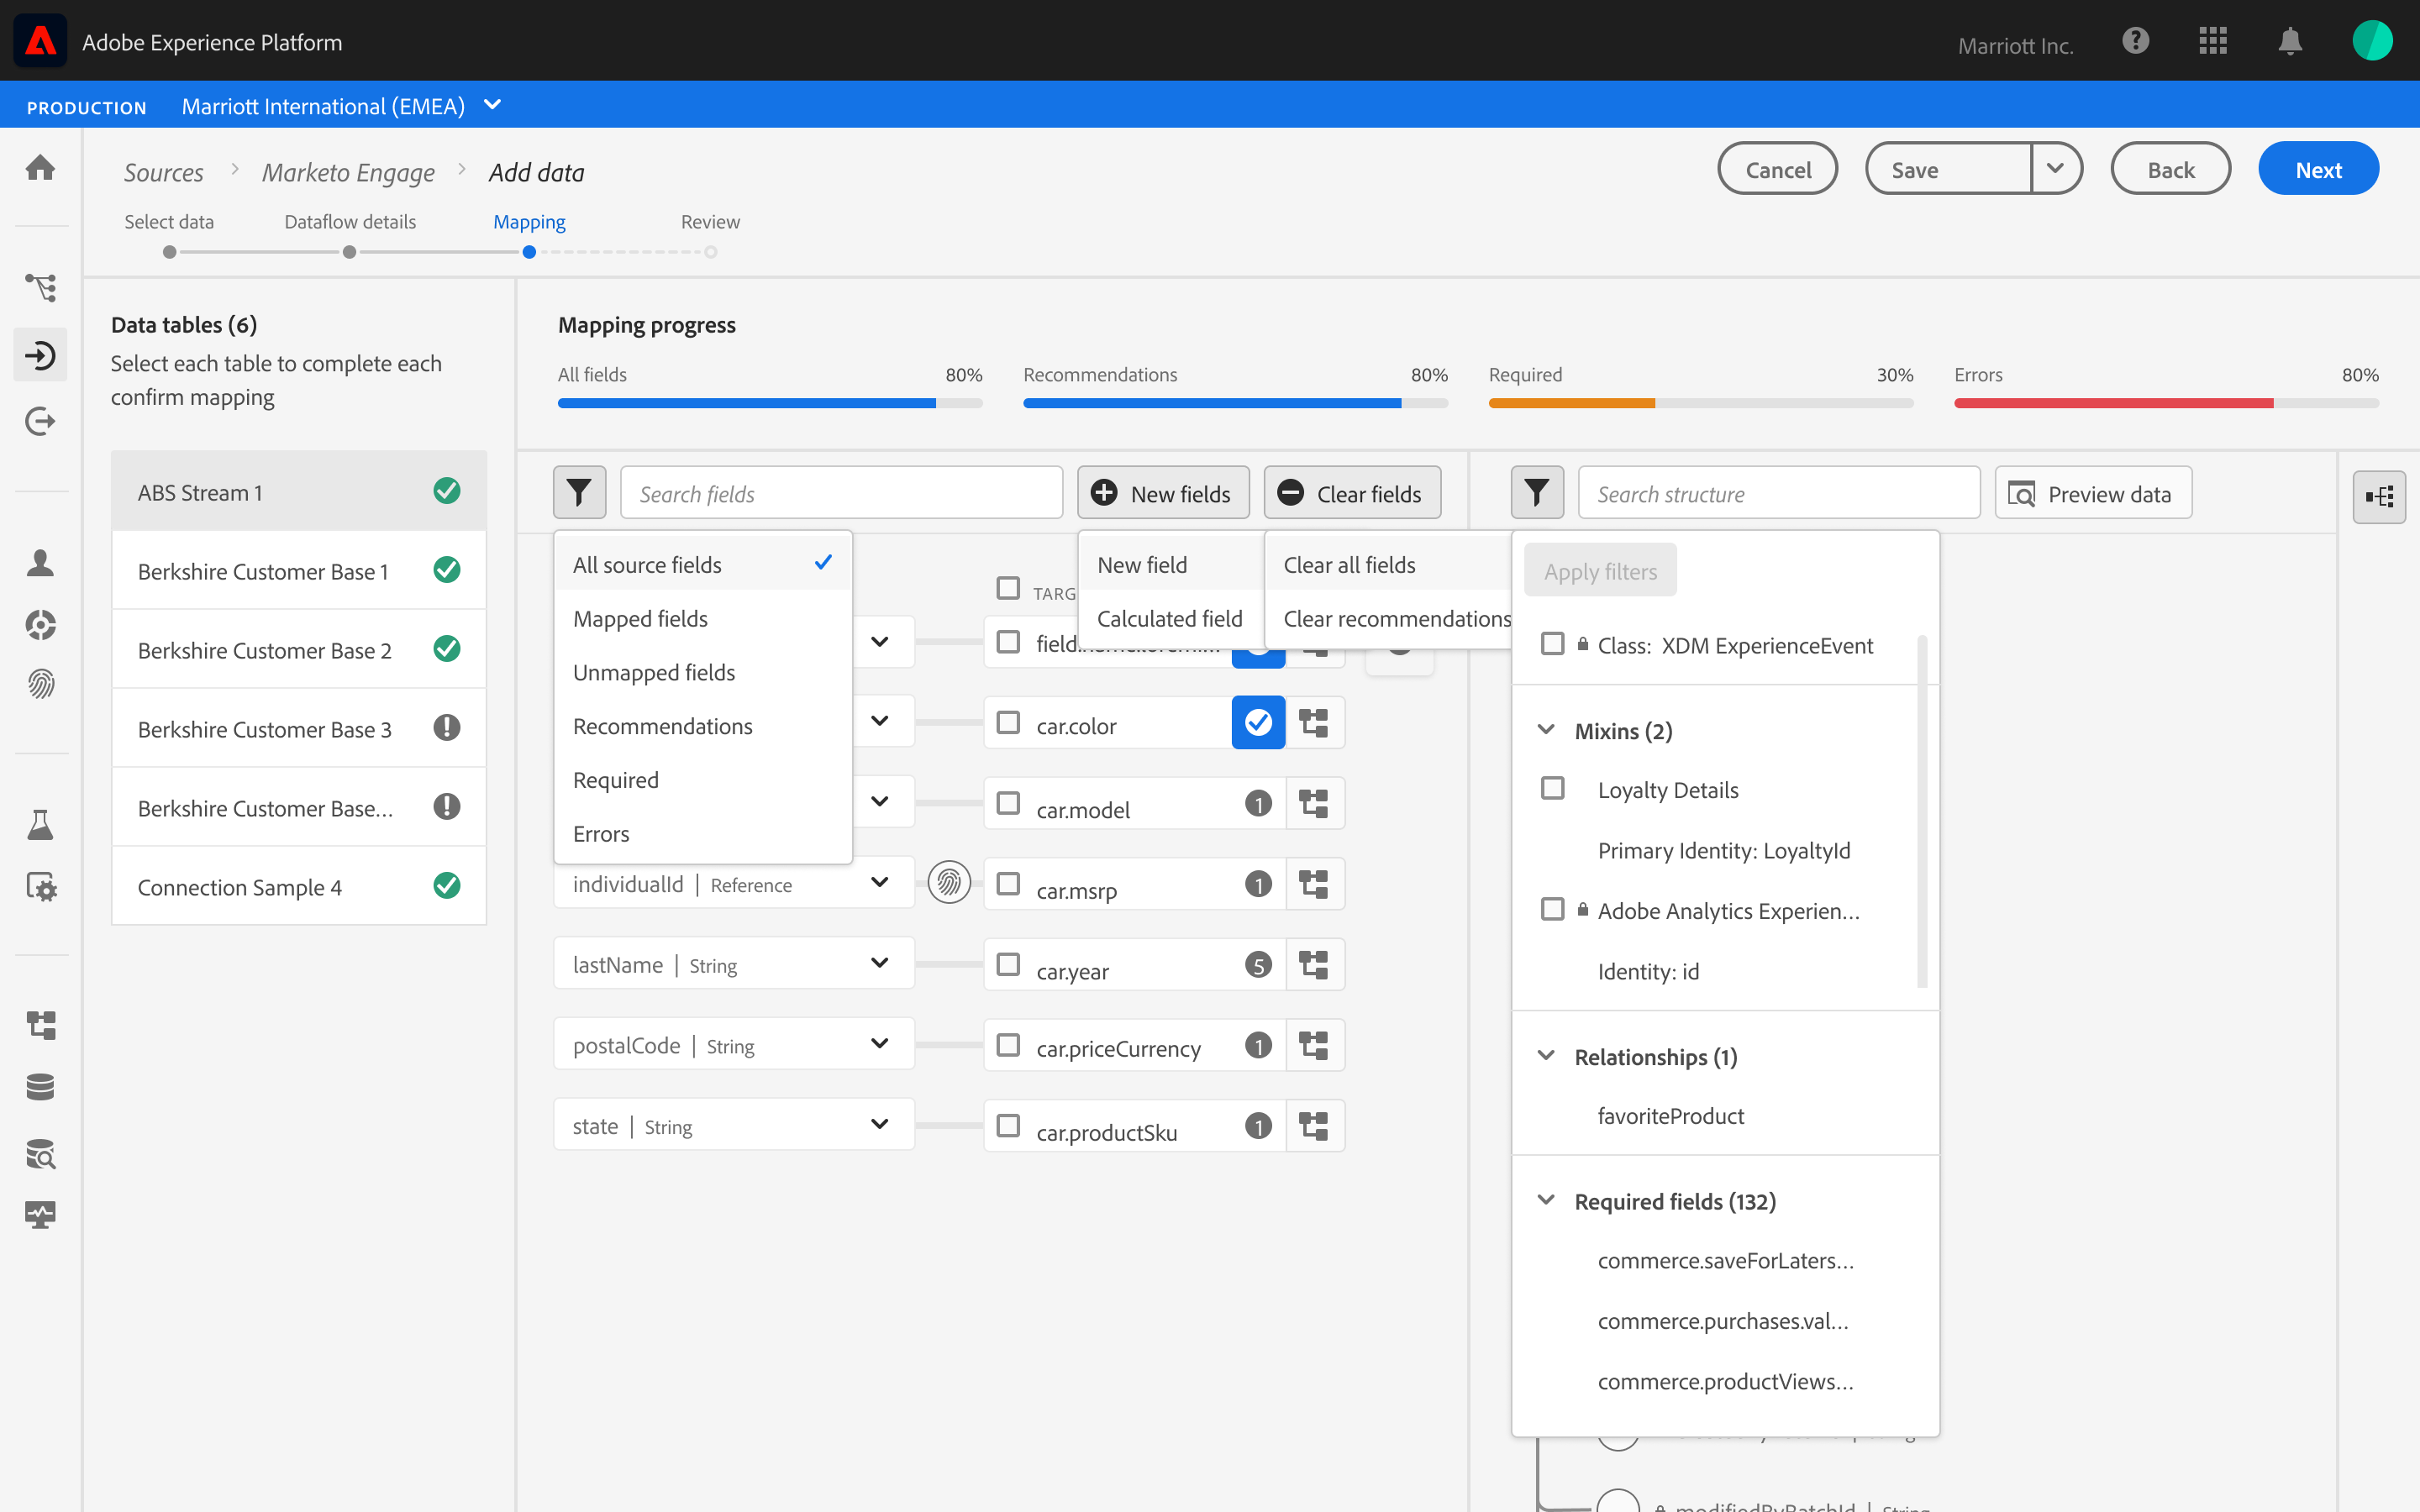
Different concept views to show levels of scoring details and when to progressively explain them if needed to apply changes and to test “Ghost States.”
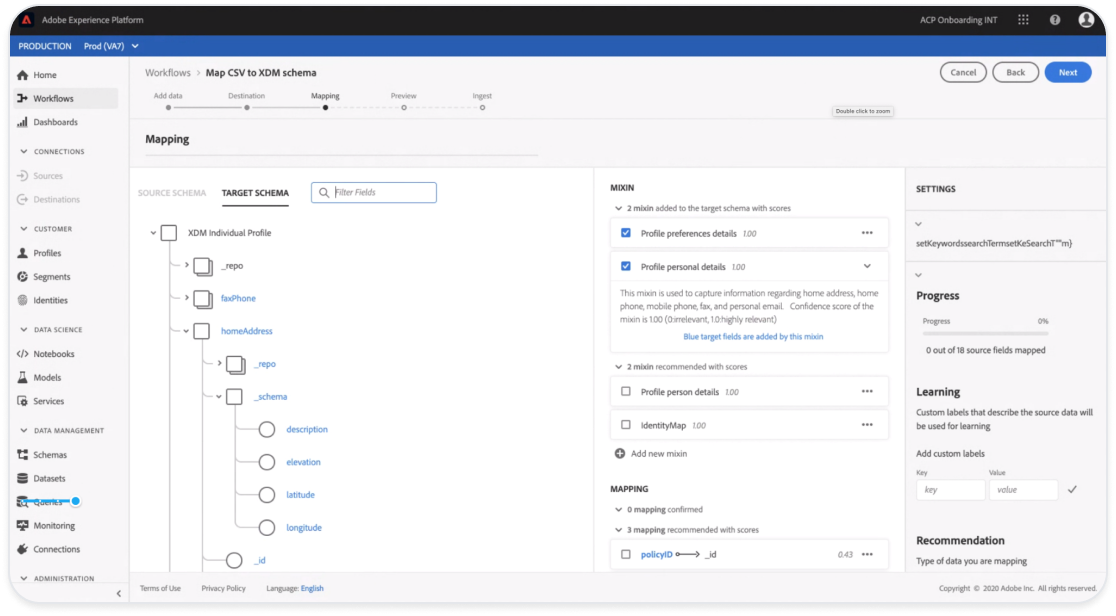
Exploring with “guessing” user intent and bulk selecting recommended mappings by schema “Mixins” (field groups). and focusing on the Schema view vs field to field mappings.
In an agile fashion I worked closely with engineering to explore hierarchy of what views are most important for the user when reviewing field mapping recommendations and “Why” they were recommended vs users intent for ingestion this source of raw data.
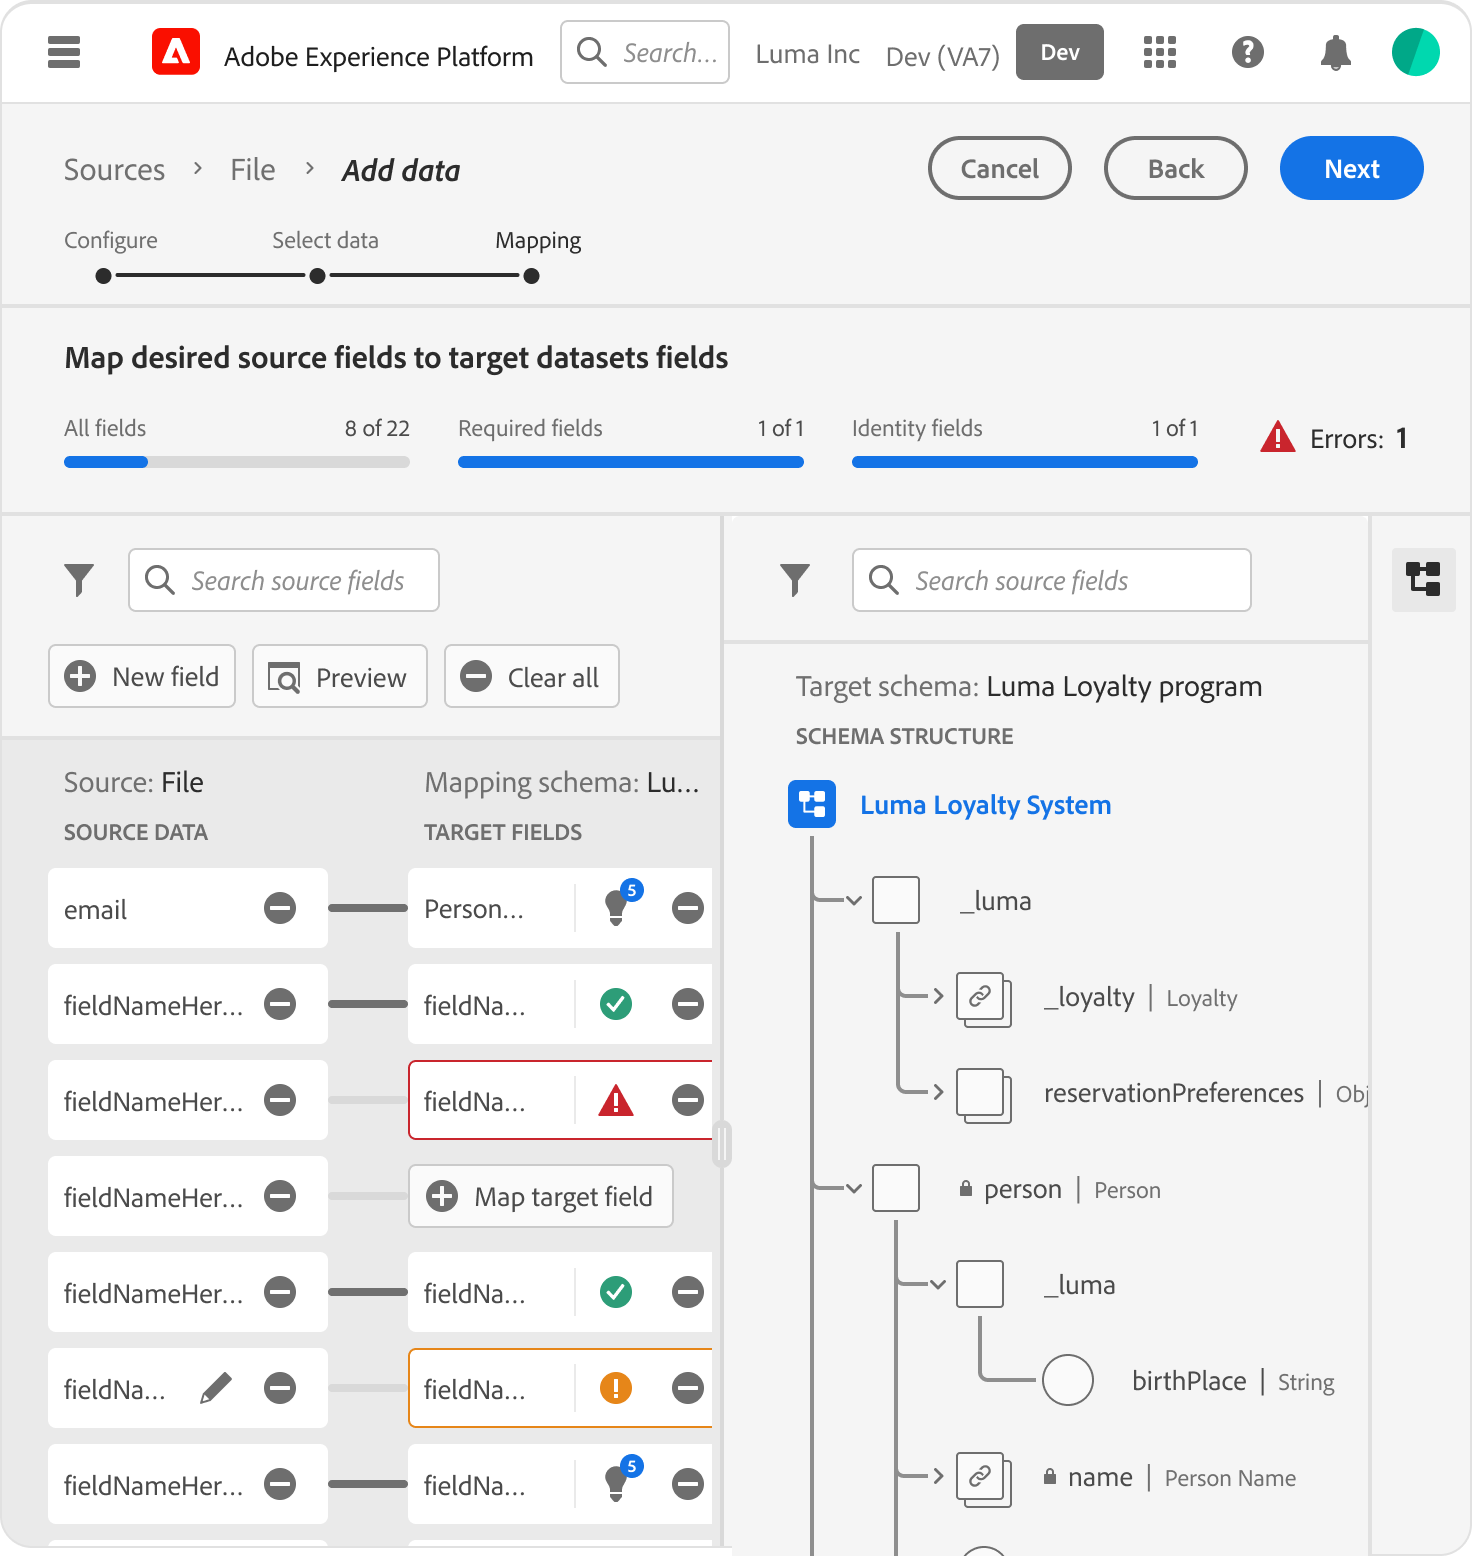
The Asynchronous Handshake: Orchestrating Human-AI Collaboration
A State-Based Storyboards: Solving for Momentum, Explainability, and Governance
1.
Contextual Entry:
Architect arrives at the mapping stage with pre-populated AI suggestions surfaced alongside raw source data.
2.
Optimistic Interaction:
The Target Schema panel expands instantly on selection; a Ghost State placeholder bridges the 5s backend lookup.
3.
Structural Wayfinding:
Highlighting a suggested field auto-traverses the schema tree to reveal the target field’s nested hierarchy and parent object.
4.
Mapping Dissociation:
User servers the link; the system updates dependencies and returns the source field to the unmapped pool.
5.
Alternative Inference (evidence and reasoning):
Architect reviews confidence scores for secondary recommendations, offering a “Human-in-the-Loop” choice for complex mappings.
6.
The Trust Audit:
Governance-Led validation: Decoupling accuracy from risk.
The audit modal surfaces the PII Governance loop, allowing Architects to reconcile high-confidence AI matches with organizational safety policies. By exposing the ‘Why’ behind both the match score and the risk flag, we provide the Explainable AI (XAI) necessary for an audited, compliant handoff.”
7.
Inventory Grooming:
Bulk-selection and filtering allow the Architect to prune irrelevant source fields, reducing the data ingestion footprint.
8.
Validation & Handoff:
Finalized mappings are committed to dataflow, transitioning the Architect from configuration to ingestion review
Features
Numerical Scoring: Deferred
Focused on qualitative trust over quantitative “guessing.”
Bulk-Mapping: Deferred
Risk of high-volume error propagation; prioritized precision.
Ghost States: Launched
Essential to solve the 5s Asynchronous Constraint.
XAI Rationale: Launched
Critical for building user trust in the AI “Black Box.”
The Strategy of Omission (Deferred Features)
Roadmap Prioritizaiton: Balancing MVP Speed with System Sxalability
To ensure a successful V1 launch against tight engineering constraints, I led the effort to prioritize ‘High-Value/Low-Effort’ logic over ‘Nice-to-Have’ convenience features. We strategically deffered several complex patterns to focus on the core ‘Handshake’ reliabilty.”
The Final Handshake (Trust & Governance)
From a “Black Box” to Explainable AI by Standardizing the Human-in-the-Loop Experience
The final release successfully dismantled the ‘Trust Gap’ by moving from an opaque, automated process to an Explainable AI (XAI) framework. By decoupling Semantic Accuracy (the ML match) from Data Compliance (the PII flag), we empowered Architects to make high-stakes decisions without slowing down their workflow. This turned a technical bottleneck into a strategic governance feature.
System Impact
& Results
Closing the Handshake: Quantifying Human-AI Synergy
90% Confidence Threshold
3 Entry Points to 1 Unified UI
Engineering & Performance Impact


Perceived Performance
Optimistic ghost states masked a 5-second backend latency, reducing interaction friction and preventing session abandonment during complex ingestions.


System Scalability
Modular service components enabled mapping logic reuse across three Adobe Cloud entry points, significantly reducing redundant UI development.
Before: Manual Mapping
Field-by-field manual matching
No confidence signal
Late-stage PII discovery
High audit overhead
Errors discovered downstream
After: AI-Assisted Mapping
ML-powered recommendations
Confidence score & rationale
Inline governance checks
Targeted human verification
Errors prevented pre-ingestion
Governance & Data Quality

100% Compliance by Design
Integrating the PII Governance Loop directly into the mapping flow ensured that 100% of sensitive fields were flagged before ingestion, preventing downstream legal risks and costly data deletions

Mapping Accuracy
Human-in-the-loop verification combined with ML suggestions resulted in higher data fidelity within the Schema Registry, ensuring cleaner “downstream” profile segments for Marketing Ops.
“We eliminated an entire class of ingestion failures that previously required manual intervention, once ML suggestions were grounded in schema truth and governance checks.”
– Product Manager, Data Platform Engineering
Outcomes
The Strategic Ripple Effect
Long-term shifts in behavior, trust, and organizational scaling

Persona Elevation
From Doer to Reviewer
We successfully shifted the Data Architect from a “Data Entry” role to a “Strategic Oversight” role. This reclamation of cognitive load allows them to manage significantly higher data volumes
The Trust Floor
From Black Box to Glass Box
Modular service components enabled mapping logic reuse across three Adobe Cloud entry points, significantly reducing redundant UI development.

The Blueprinted Handshake
From Feature to System Standard
Modular service components enabled mapping logic reuse across three Adobe Cloud entry points, significantly reducing redundant UI development.
System Impact, From Component to Ecosystem

Data Mapping Component
AI-Trust Standard
Integrated into Adobe’s XAI guidelines
Ghost States Pattern
Adopted across Adobe Cloud to high-latency operations
Design System
Blueprint for Human-AI interaction patterns
Related Case Studies
Let’s Work Together
Interested in collaborating on complex UI/UX challenges involving data, AI, or enterprise systems?
I’d love to explore how thoughtful design can drive clarity and business impact.

Get In Touch

About Kelli
Product Designer | AI x Data Systems
Passionate about turning complex data and AI systems into clear, trustworthy, human-centered experiences
Based in: San Francisco, CA
© 2026 Kelli Nordfelt
Overview
Problem
Technical Wall
Design Pivot
System Impact
Outcomes
AI-assisted Data Mapping
Human-AI Data Workflows that Reduce the Technical Floor for Global Onboarding
Solving for “Ingestion Debt” through ML-assisted mapping and Friction-by-Design governance
Data Mapping Overview
Project Snapshot
The Challenge
High-risk manual mapping created “Ingestion debt”, and errors discovered only after data reached the activation layer
The Solution
An ML-assisted mapping framework that balances automation with “Friction-by-Design” for PII governance.
Key Results
40-60% faster onboarding and a `30% reduction in mapping-related pipeline failures.
Primary Users
Data Engineers, Data Architects, and Marketing Ops teams.
Overview
This 0-GA initiative spanned 18 months, evolving from a manual field-matching tool into a Strategic Data Bridge. By standardizing how diverse source data enters the ecosystem, we established the foundational UX patterns for ML-recommendations, template reuse, and proactive drift monitoring.
My Role
As the Primary Design Lead, I orchestrated the end-to-end workflow across ingestion and mapping. I partnered with 2 Product Managers (including a domain SME) and a squad of Backend/Frontend Engineers to translate complex ML confidence scores into actionable, high-integrity UI patterns.
The Problem
The Cost of “Invisible Errors”
The Core Tension: Speed vs Governance
Historically, mapping diverse source data into a standardized schema was a “black box” operation. Users were forced to map fields manually without knowing if the data types matched downstream requirements, leading to what I termed “Ingestion Debt”.
Silent Pipeline Pollution
Architects would “successfully” map fields that appeared valid in the UI, but contained semantic mismatches. These errors remained invisible until they triggered failures in downstream segmentation.
The Late-Stage Error Loop
Errors were only discovered at the “Activation” layer (often weeks after initial setup), forcing teams to restart the 18-month onboarding cycles from scratch.
The Governance Risk
Without clear visibility into PII (Personally Identifiable Information), sensitive data often leaked into non-compliant destinations.
Critical
Mis-mapped fields produced incomplete or inaccurate audiences
High
Source onboarding and schema selection lacked clarity
High
Errors surfaced late, triggering rework and support tickets
Medium
No templates or reuse lead to repetitive manual effort
Source Fields Flow Analysis
Visualizing the Fragmentation Gap: Identifying where unmapped source fields caused downstream segmentation to fail.
Correct Mappings
90% • Activation-ready
10% • Shadow QA
Incorrect Mappings
60% • Failed activation
10% • Low-precision segment
Unmapped Fields
100% • Backlog


Backlog (10)
Low-precision segment (08)
Failed activation (12)
QA monitoring (07)
Activation-ready (63)
Correct (70)
Incorrect (20)
Unmapped (10)
(100) Source Fields
2 Stages Earlier
Error detection improvements
↓ 2 Reduced Costs
Fix issues before campaign launch
↑ Confidence
In automation and personalization
Error Discovery Timeline
Incorrect or incomplete mappings led to mismatched audiences and reduced confidence in automation and personalization outcomes

Source
connected
Field Mapping/
Validation

(Before)
Error Detected

(Before)
Error Detected

Campaign


Source
connected
Field Mapping/
Validation
Unified
Profile Schema
Segment
Build
Campaign
Source
connected


(Proposed)
Early Detection
Field Mapping/
Validation
Segment
Build
Campaign
Cross-team Journey Map
Mapping workflow and failure analysis helped identify where segmentation breaks, why it happens, and who it impacts.
Critical
Late error detection & schema drift created unclear mapping outcomes
Leads to rework loops, broken segments, and failed activation
High
Ambiguous fields along with tribal knowledge drive mis-mapping and low trust
Slows onboarding and reduces confidence in audiences
Medium
Manual and repetitive mapping with limited tooling
Increases time to first segment and hurts scalability
Source Connection
Field Discovery
Mapping
Validation
Publishing
Segment Creation
Activation
Data Engineer
TASK

Configure source systems & credentials
TASK

Scan and identify available fields
TASK
Map source to target schema
TASK
Test data transformation
Data Ops
TASK
Review connection permissions
TASK
Validate mapping rules
TASK
Deploy to production
Marketing Ops
TASK

Define business field requirements
TASK
Build audience segments
TASK
Launch campaigns
Analyst
TASK
Review field relevance
TASK
Verify data accuracy
TASK
Define segment criteria
System automation
TASK
Run automated checks
TASK
Schedule sync jobs
TASK
Sync to activation platforms
The Technical Wall
The Probability vs Policy Paradox
The Constraint: AI is Probabilistic, Governance is Binary
The core technical challenge was that out ML models produced Confidence Scores, not certainties. In a consumer app, an 80% match is a win; in Enterprise PII (Personally Identifiable Information) mapping, a 20% margin of error is a legal and structural liability.
The Black Box Problem
The Wall
Early versions of the ML-mapping engine “just worked,” but provided no “why” behind the suggestions.
User Mistrust
Architects, wary of “Silent Pipeline Pollution.” would spend more time auditing the AI’s work than it would have taken to map the fields manually.
Performance Reality
Backend processing for real-time ML suggestions across 1,000+ fields introduced a 5-second latency, threatening the “consumer-grade” flow UX had initially promised.
The Mapping Paradox
If we automated everything, we lost human accountability for PII. If we automated nothing, we couldn’t lower the technical floor for onboarding.
Confidence vs. Risk — Human Accountability Matrix
AI-driven data mapping governance framework
(Identifying the “Danger Zone”, where high-sensitivity fields, were being mapped with low-to-medium confidence scores)
Restricted / PII
Data Sensitivity Level
Policy-Driven
Public
DANGER ZONE
Mandatory Human Review
Uncertain output applied to regulated data creates unacceptable risk.


SSN
GOVERNANCE ZONE
Secondary Verification
High confidence does not override policy-driven accountability.
SSN
AUDIT ZONE
Bulk Review
Uncertainty is acceptable when failure impact is low.
SAFE ZONE
Auto-Accept
Low-risk fields can be safely automated to reduce onboarding friction.
0%
25%
50%
75%
100%
Uncertainty
ML Confidence Score
Latency Sequence map
Server-Side Execution Time & Asynchronous Constraint

Non-blocking/Staged UI
(Suggestion Pending)
User / UI

ML Engine

Selects source field
[e.g., ‘src_email]

Analyze
Semantic patterns
Suggestion Pending
(non-blocking/Staged UI)
Schema Registry

Return Schema Metadata
Fetch Schema Definitions


Governance
Check PII Constraints
200: [Suggested+Field:
“emailPrimary”, PII: true]
User/UI
Trigger Manual Verification
(Friction-by-Design)
Asynchronous Constraint

User action

Backend loop
~5s Latency Wall
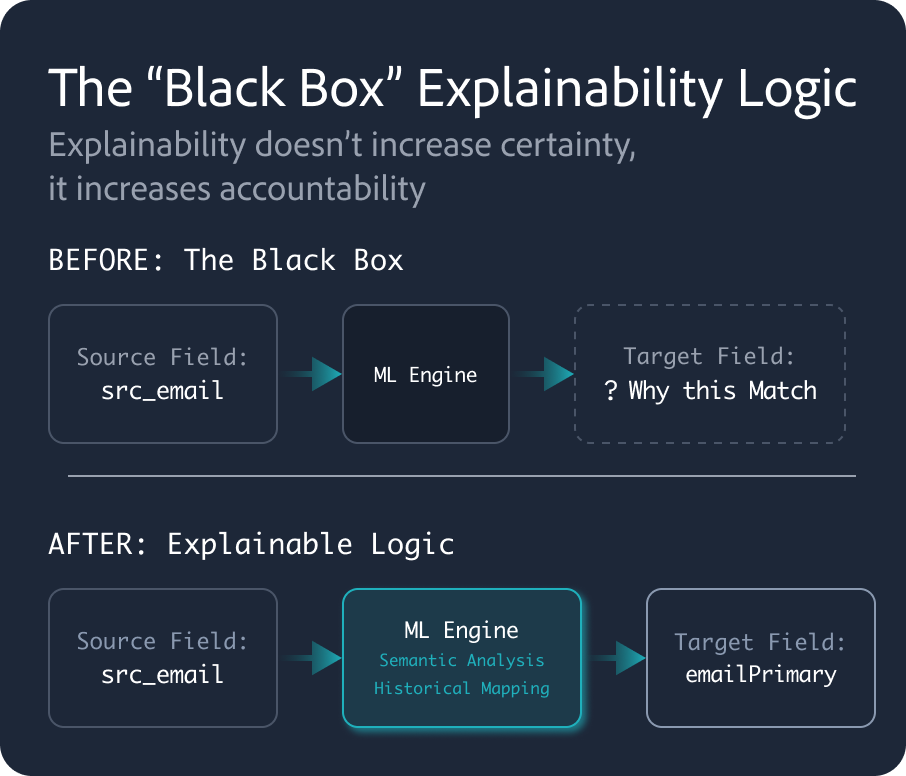
The “Black Box” Explainability Logic
Explainability doesn’t increase certainty, it increases accountability
BEFORE: The Black Box
Source Field:
src_email

ML Engine
Target Field:
?
Why this Match

AFTER: Explainable Logic
Source Field:
src_email
ML Engine
Semantic Analysis
Historical Mapping
Target Field:
emailPrimary
The Design Pivot
From System Constraints to User Flows
Ecosystem Mapping & Entry points
Before solving the mapping interface, we had to solve for the “Where”. Mapping isn’t a single-page task; it’s a utility that needs to exist across the Adobe ecosystem (Ingestion, Schema Editor, Profile). Instead of the bespoke page, I designed a Modular Service Component.
Cross-team Kick-off Workshop: Alignment on the “Handshake” lifecycle
During these sprints we focused on:
- Understanding the problem, and set our expected outcomes
- Worked through and understand technology dependencies
- Explored user goals and value statements
- Developed low-fi solutions (design and dev)
- Presented and validated with stakeholders and customers
Macro-level Entry Point Diagram
How this “handshake” plugs into different Adobe Experience Cloud apps
Data Ingestion Workflow: Cross-Functional Orchestration
Where Marketing Ops, Data Engineers, and Data Architects intersect
The ‘Handshake’ occurs at the critical juncture between Selecting Raw Data Mapping and Dataflow Review.
Workflow recommendations
Reduced steps within workflows and unified design system patterns
Defining the Handshake Grammar (Anatomy & Specs)
Standardizing the communication between the Architect and the Machine. Raw metadata (Sources) and standardized XDM (Target Schema) speak different languages.
Users were confused by mismatched datatypes. To establish a Metadata-First Visual Grammar I aligned the UI with Adobe’s “Spectrum” design system but added specific specs for AI-confidence and data-origin metadata.
Patterns and Guiding Principles
Identified important questions to keep in mind during exploration
- How might we remind users why we are normalizing the data?
- How do we make sure our solutions are performance based?
- How might the user expect to approach the tools?
- How can we reduce redundancies?
Spectrum Design System Guidelines
(*Reference guide for all Adobe Cloud Editors)
Anatomy
Metadata transparency and system alignment
Behavioral Design
State management and the 5-second latency solution
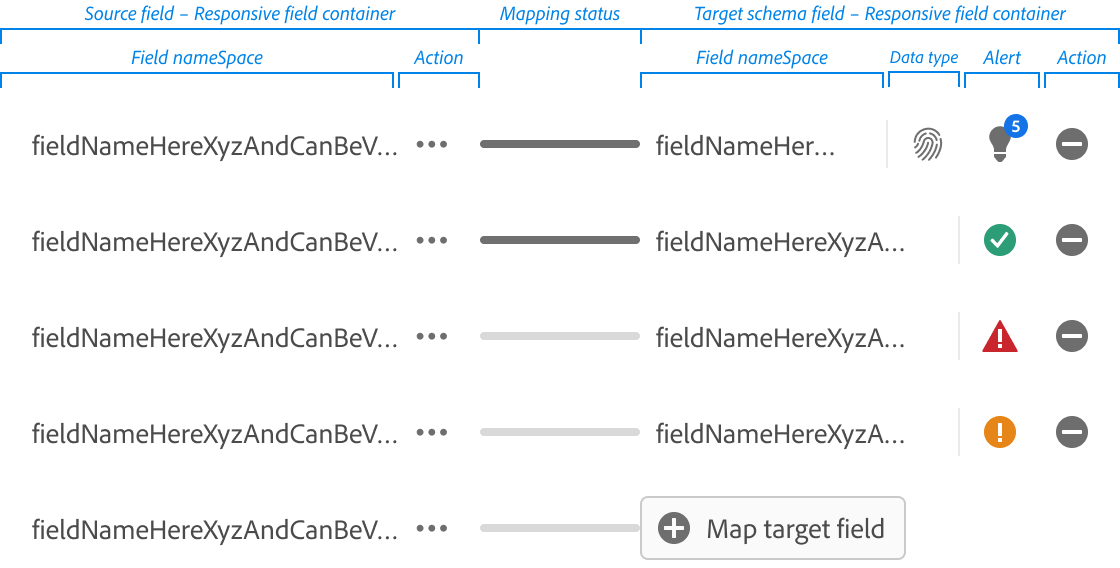
Mapping Fields Anatomy
Source field – Responsive field container
Mapping status
Target schema field – Responsive field container
Field nameSpace
Action
Field nameSpace
Data type
Alert
Action
fieldNameHereXyzAndCanBeVerylongFieldNameHereXyzAndCanBeVerylong

fieldNameHereXyzAndCanBeVerylongFieldNameHereXyzAndCanBeVerylong


5


fieldNameHereXyzAndCanBeVerylongFieldNameHereXyzAndCanBeVerylong
fieldNameHereXyzAndCanBeVerylongFieldNameHereXyzAndCanBeVerylong


fieldNameHereXyzAndCanBeVerylongFieldNameHereXyzAndCanBeVerylong
fieldNameHereXyzAndCanBeVerylongFieldNameHereXyzAndCanBeVerylong


fieldNameHereXyzAndCanBeVerylongFieldNameHereXyzAndCanBeVerylong
fieldNameHereXyzAndCanBeVerylongFieldNameHereXyzAndCanBeVerylong

fieldNameHereXyzAndCanBeVerylongFieldNameHereXyzAndCanBeVerylong


Map target field
Navigating the 5-second Gap
Initial Engineering prototypes confirmed the 5-second server-side delay. A standard loading spinner created a “Momentum Gap” that frustrated power users.
Users were confused by mismatched datatypes. To establish a Metadata-First Visual Grammar I aligned the UI with Adobe’s “Spectrum” design system but added specific specs for AI-confidence and data-origin metadata.
Rapid prototyping w/ Engineering
Different concept views to show levels of scoring details and when to progressively explain them if needed to apply changes and to test “Ghost States.”
Exploring with “guessing” user intent and bulk selecting recommended mappings by schema “Mixins” (field groups). and focusing on the Schema view vs field to field mappings.
In an agile fashion I worked closely with engineering to explore hierarchy of what views are most important for the user when reviewing field mapping recommendations and “Why” they were recommended vs users intent for ingestion this source of raw data.
The Strategy of Omission (Deferred Features)
Roadmap Prioritizaiton: Balancing MVP Speed with System Sxalability
To ensure a successful V1 launch against tight engineering constraints, I led the effort to prioritize ‘High-Value/Low-Effort’ logic over ‘Nice-to-Have’ convenience features. We strategically deffered several complex patterns to focus on the core ‘Handshake’ reliabilty.”
Feature
Status
Design Rationale
XAI Rationale
Launched
Critical for building user trust in the AI “Black Box.”
Ghost States
Launched
Essential to solve the 5s Asynchronous Constraint.
Bulk-Mapping
Deferred
Risk of high-volume error propagation; prioritized precision.
Numerical Scoring
Deferred
Focused on qualitative trust over quantitative “guessing.”
The Asynchronous Handshake: Orchestrating Human-AI Collaboration
A State-Based Storyboards: Solving for Momentum, Explainability, and Governance
1.
Contextual Entry:
Architect arrives at the mapping stage with pre-populated AI suggestions surfaced alongside raw source data.
2.
Optimistic Interaction:
The Target Schema panel expands instantly on selection; a Ghost State placeholder bridges the 5s backend lookup.
3.
Structural Wayfinding:
Highlighting a suggested field auto-traverses the schema tree to reveal the target field’s nested hierarchy and parent object.
4.
Mapping Dissociation:
User servers the link; the system updates dependencies and returns the source field to the unmapped pool.
5.
Alternative Inference (evidence and reasoning):
Architect reviews confidence scores for secondary recommendations, offering a “Human-in-the-Loop” choice for complex mappings.
6.
The Trust Audit:
Governance-Led validation: Decoupling accuracy from risk.
The audit modal surfaces the PII Governance loop, allowing Architects to reconcile high-confidence AI matches with organizational safety policies. By exposing the ‘Why’ behind both the match score and the risk flag, we provide the Explainable AI (XAI) necessary for an audited, compliant handoff.”
7.
Inventory Grooming:
Bulk-selection and filtering allow the Architect to prune irrelevant source fields, reducing the data ingestion footprint.
8.
Validation & Handoff:
Finalized mappings are committed to dataflow, transitioning the Architect from configuration to ingestion review
The Final Handshake (Trust & Governance)
From a “Black Box” to Explainable AI by Standardizing the Human-in-the-Loop Experience
The final release successfully dismantled the ‘Trust Gap’ by moving from an opaque, automated process to an Explainable AI (XAI) framework. By decoupling Semantic Accuracy (the ML match) from Data Compliance (the PII flag), we empowered Architects to make high-stakes decisions without slowing down their workflow. This turned a technical bottleneck into a strategic governance feature.
System Impact & Results
Closing the Handshake: Quantifying Human-AI Synergy
40-60%
Faster to First Usable Segment
Reduced onboarding time through AI-assisted mapping
25-40%
Mapping Accuracy Lift
Human-in-the-loop verification & ML suggestions
-30%
Fewer Mapping-Related Segmentation breakages
Improved downstream data integrity
90% Confidence Threshold
3 Entry Points to 1 Unified UI
Engineering & Performance Impact
Perceived Performance
Optimistic ghost states masked a 5-second backend latency, reducing interaction friction and preventing session abandonment during complex ingestions.
System Scalability
Modular service components enabled mapping logic reuse across three Adobe Cloud entry points, significantly reducing redundant UI development.
Before: Manual Mapping
After: AI-Assisted Mapping
Field-by-field manual matching
ML-powered recommendations
No confidence signal
Confidence score & rationale
Late-stage PII discovery
Inline governance checks
High audit overhead
Targeted human verification
Errors discovered downstream
Errors prevented pre-ingestion
Governance & Data Quality

100% Compliance by Design
Integrating the PII Governance Loop directly into the mapping flow ensured that 100% of sensitive fields were flagged before ingestion, preventing downstream legal risks and costly data deletions
Mapping Accuracy
Human-in-the-loop verification combined with ML suggestions resulted in higher data fidelity within the Schema Registry, ensuring cleaner “downstream” profile segments for Marketing Ops.
“We eliminated an entire class of ingestion failures that previously required manual intervention, once ML suggestions were grounded in schema truth and governance checks.”
– Product Manager, Data Platform Engineering
Outcomes
The Strategic Ripple Effect
Long-term shifts in behavior, trust, and organizational scalling
Persona Elevation
From Doer to Reviewer
We successfully shifted the Data Architect from a “Data Entry” role to a “Strategic Oversight” role. This reclamation of cognitive load allows them to manage significantly higher data volumes
The Trust Floor
From Black Box to Glass Box
Modular service components enabled mapping logic reuse across three Adobe Cloud entry points, significantly reducing redundant UI development.
The Blueprinted Handshake
From Feature to System Standard
Modular service components enabled mapping logic reuse across three Adobe Cloud entry points, significantly reducing redundant UI development.
System Impact, From Component to Ecosystem
Data Mapping Component
AI-Trust Standard
Integrated into Adobe’s XAI guidelines
Ghost States Pattern
Adopted across Adobe Cloud to high-latency operations
Design System
Blueprint for Human-AI interaction patterns
Related Case Studies
Let’s Work Together
Interested in collaborating on complex UI/UX challenges involving data, AI, or enterprise systems?
I’d love to explore how thoughtful design can drive clarity and business impact.
Get In Touch
About Kelli
Product Designer | AI x Data Systems
Passionate about turning complex data and AI systems into clear, trustworthy, human-centered experiences
Based in: San Francisco, CA
© 2026 Kelli Nordfelt

Overview
Problem
Technical Wall
Design Pivot
System Impact
Outcomes
AI-assisted Data Mapping
Human-AI Data Workflows that Reduce the Technical Floor for Global Onboarding
Solving for “Ingestion Debt” through ML-assisted mapping and Friction-by-Design governance
Data Mapping Overview
Project Snapshot
The Challenge
High-risk manual mapping created “Ingestion debt”, and errors discovered only after data reached the activation layer
The Solution
An ML-assisted mapping framework that balances automation with “Friction-by-Design” for PII governance.
Key Results
40-60% faster onboarding and a `30% reduction in mapping-related pipeline failures.
Primary Users
Data Engineers, Data Architects, and Marketing Ops teams.
Overview
This 0-GA initiative spanned 18 months, evolving from a manual field-matching tool into a Strategic Data Bridge. By standardizing how diverse source data enters the ecosystem, we established the foundational UX patterns for ML-recommendations, template reuse, and proactive drift monitoring.
My Role
As the Primary Design Lead, I orchestrated the end-to-end workflow across ingestion and mapping. I partnered with 2 Product Managers (including a domain SME) and a squad of Backend/Frontend Engineers to translate complex ML confidence scores into actionable, high-integrity UI patterns.
The Problem
The Cost of “Invisible Errors”
The Core Tension: Speed vs Governance
Historically, mapping diverse source data into a standardized schema was a “black box” operation. Users were forced to map fields manually without knowing if the data types matched downstream requirements, leading to what I termed “Ingestion Debt”.
Silent Pipeline Pollution
Architects would “successfully” map fields that appeared valid in the UI, but contained semantic mismatches. These errors remained invisible until they triggered failures in downstream segmentation.
The Late-Stage Error Loop
Errors were only discovered at the “Activation” layer (often weeks after initial setup), forcing teams to restart the 18-month onboarding cycles from scratch.
The Governance Risk
Without clear visibility into PII (Personally Identifiable Information), sensitive data often leaked into non-compliant destinations.
Critical
Mis-mapped fields produced incomplete or inaccurate audiences
High
Source onboarding and schema selection lacked clarity
High
Errors surfaced late, triggering rework and support tickets
Medium
No templates or reuse lead to repetitive manual effort
Source Fields Flow Analysis
Visualizing the Fragmentation Gap: Identifying where unmapped source fields caused downstream segmentation to fail.
Correct Mappings
90% • Activation-ready
10% • Shadow QA
Incorrect Mappings
60% • Failed activation
10% • Low-precision segment
Unmapped Fields
100% • Backlog


Backlog (10)
Low-precision segment (08)
Failed activation (12)
QA monitoring (07)
Activation-ready (63)
Correct (70)
Incorrect (20)
Unmapped (10)
(100) Source Fields
2 Stages Earlier
Error detection improvements
↓ 2 Reduced Costs
Fix issues before campaign launch
↑ Confidence
In automation and personalization
Error Discovery Timeline
Incorrect or incomplete mappings led to mismatched audiences and reduced confidence in automation and personalization outcomes
Source
connected
Field Mapping/
Validation
(Before)
Error Detected
(Before)
Error Detected
Campaign
Source
connected
Field Mapping/
Validation
Unified
Profile Schema
Segment
Build
Campaign
Source
connected
(Proposed)
Early Detection
Field Mapping/
Validation
Segment
Build
Campaign
Cross-team Journey Map
Mapping workflow and failure analysis helped identify where segmentation breaks, why it happens, and who it impacts.
Critical
Late error detection & schema drift created unclear mapping outcomes
Leads to rework loops, broken segments, and failed activation
High
Ambiguous fields along with tribal knowledge drive mis-mapping and low trust
Slows onboarding and reduces confidence in audiences
Medium
Manual and repetitive mapping with limited tooling
Increases time to first segment and hurts scalability
Source Connection
Field Discovery
Mapping
Validation
Publishing
Segment Creation
Activation
Data Engineer
TASK
Configure source systems & credentials
TASK
Scan and identify available fields
TASK
Map source to target schema
TASK
Test data transformation
Data Ops
TASK
Review connection permissions
TASK
Validate mapping rules
TASK
Deploy to production
Marketing Ops
TASK
Define business field requirements
TASK
Build audience segments
TASK
Launch campaigns
Analyst
TASK
Review field relevance
TASK
Verify data accuracy
TASK
Define segment criteria
System automation
TASK
Run automated checks
TASK
Schedule sync jobs
TASK
Sync to activation platforms
The Technical Wall
The Probability vs Policy Paradox
The Constraint: AI is Probabilistic, Governance is Binary
The core technical challenge was that out ML models produced Confidence Scores, not certainties. In a consumer app, an 80% match is a win; in Enterprise PII (Personally Identifiable Information) mapping, a 20% margin of error is a legal and structural liability.
The Black Box Problem
The Wall
Early versions of the ML-mapping engine “just worked,” but provided no “why” behind the suggestions.
User Mistrust
Architects, wary of “Silent Pipeline Pollution.” would spend more time auditing the AI’s work than it would have taken to map the fields manually.
Performance Reality
Backend processing for real-time ML suggestions across 1,000+ fields introduced a 5-second latency, threatening the “consumer-grade” flow UX had initially promised.
The Mapping Paradox
If we automated everything, we lost human accountability for PII. If we automated nothing, we couldn’t lower the technical floor for onboarding.
Confidence vs. Risk — Human Accountability Matrix
AI-driven data mapping governance framework
(Identifying the “Danger Zone”, where high-sensitivity fields, were being mapped with low-to-medium confidence scores)
Restricted / PII
Data Sensitivity Level
Policy-Driven
Public
DANGER ZONE
Mandatory Human Review
Uncertain output applied to regulated data creates unacceptable risk.
SSN
GOVERNANCE ZONE
Secondary Verification
High confidence does not override policy-driven accountability.
SSN
AUDIT ZONE
Bulk Review
Uncertainty is acceptable when failure impact is low.
SAFE ZONE
Auto-Accept
Low-risk fields can be safely automated to reduce onboarding friction.
0%
25%
50%
75%
100%
Uncertainty
ML Confidence Score
Latency Sequence map
Server-Side Execution Time & Asynchronous Constraint

Non-blocking/Staged UI
(Suggestion Pending)
User / UI
ML Engine
Selects source field
[e.g., ‘src_email]
Analyze
Semantic patterns
Suggestion Pending
(non-blocking/Staged UI)
Schema Registry
Return Schema Metadata
Fetch Schema Definitions

Governance
Check PII Constraints
200: [Suggested+Field:
“emailPrimary”, PII: true]
User/UI
Trigger Manual Verification
(Friction-by-Design)
Asynchronous Constraint
User action
Backend loop
~5s Latency Wall
The “Black Box” Explainability Logic
Explainability doesn’t increase certainty, it increases accountability
BEFORE: The Black Box
Source Field:
src_email
ML Engine
Target Field:
?
Why this Match

AFTER: Explainable Logic
Source Field:
src_email
ML Engine
Semantic Analysis
Historical Mapping
Target Field:
emailPrimary
The Design Pivot
From System Constraints to User Flows
Ecosystem Mapping & Entry points
Before solving the mapping interface, we had to solve for the “Where”. Mapping isn’t a single-page task; it’s a utility that needs to exist across the Adobe ecosystem (Ingestion, Schema Editor, Profile). Instead of the bespoke page, I designed a Modular Service Component.
Cross-team Kick-off Workshop: Alignment on the “Handshake” lifecycle
During these sprints we focused on:
- Understanding the problem, and set our expected outcomes
- Worked through and understand technology dependencies
- Explored user goals and value statements
- Developed low-fi solutions (design and dev)
- Presented and validated with stakeholders and customers
Macro-level Entry Point Diagram
How this “handshake” plugs into different Adobe Experience Cloud apps
Data Ingestion Workflow: Cross-Functional Orchestration
Where Marketing Ops, Data Engineers, and Data Architects intersect
The ‘Handshake’ occurs at the critical juncture between Selecting Raw Data Mapping and Dataflow Review.
Workflow recommendations
Reduced steps within workflows and unified design system patterns
Defining the Handshake Grammar (Anatomy & Specs)
Standardizing the communication between the Architect and the Machine. Raw metadata (Sources) and standardized XDM (Target Schema) speak different languages.
Users were confused by mismatched datatypes. To establish a Metadata-First Visual Grammar I aligned the UI with Adobe’s “Spectrum” design system but added specific specs for AI-confidence and data-origin metadata.
Patterns and Guiding Principles
Identified important questions to keep in mind during exploration
- How might we remind users why we are normalizing the data?
- How do we make sure our solutions are performance based?
- How might the user expect to approach the tools?
- How can we reduce redundancies?
Spectrum Design System Guidelines
(*Reference guide for all Adobe Cloud Editors)
Anatomy
Metadata transparency and system alignment
Behavioral Design
State management and the 5-second latency solution
Mapping Fields Anatomy
Source field – Responsive field container
Mapping status
Target schema field – Responsive field container
Field nameSpace
Action
Field nameSpace
Data type
Alert
Action
fieldNameHereXyzAndCanBeVerylongFieldNameHereXyzAndCanBeVerylong
fieldNameHereXyzAndCanBeVerylongFieldNameHereXyzAndCanBeVerylong
5
fieldNameHereXyzAndCanBeVerylongFieldNameHereXyzAndCanBeVerylong
fieldNameHereXyzAndCanBeVerylongFieldNameHereXyzAndCanBeVerylong
fieldNameHereXyzAndCanBeVerylongFieldNameHereXyzAndCanBeVerylong
fieldNameHereXyzAndCanBeVerylongFieldNameHereXyzAndCanBeVerylong
fieldNameHereXyzAndCanBeVerylongFieldNameHereXyzAndCanBeVerylong
fieldNameHereXyzAndCanBeVerylongFieldNameHereXyzAndCanBeVerylong
fieldNameHereXyzAndCanBeVerylongFieldNameHereXyzAndCanBeVerylong
Map target field
Navigating the 5-second Gap
Initial Engineering prototypes confirmed the 5-second server-side delay. A standard loading spinner created a “Momentum Gap” that frustrated power users.
Users were confused by mismatched datatypes. To establish a Metadata-First Visual Grammar I aligned the UI with Adobe’s “Spectrum” design system but added specific specs for AI-confidence and data-origin metadata.
Rapid prototyping w/ Engineering
Different concept views to show levels of scoring details and when to progressively explain them if needed to apply changes and to test “Ghost States.”
Exploring with “guessing” user intent and bulk selecting recommended mappings by schema “Mixins” (field groups). and focusing on the Schema view vs field to field mappings.
In an agile fashion I worked closely with engineering to explore hierarchy of what views are most important for the user when reviewing field mapping recommendations and “Why” they were recommended vs users intent for ingestion this source of raw data.
The Strategy of Omission (Deferred Features)
Roadmap Prioritizaiton: Balancing MVP Speed with System Sxalability
To ensure a successful V1 launch against tight engineering constraints, I led the effort to prioritize ‘High-Value/Low-Effort’ logic over ‘Nice-to-Have’ convenience features. We strategically deffered several complex patterns to focus on the core ‘Handshake’ reliabilty.”
Feature
Status
Design Rationale
XAI Rationale
Launched
Critical for building user trust in the AI “Black Box.”
Ghost States
Launched
Essential to solve the 5s Asynchronous Constraint.
Bulk-Mapping
Deferred
Risk of high-volume error propagation; prioritized precision.
Numerical Scoring
Deferred
Focused on qualitative trust over quantitative “guessing.”
The Asynchronous Handshake: Orchestrating Human-AI Collaboration
A State-Based Storyboards: Solving for Momentum, Explainability, and Governance
1.
Contextual Entry:
Architect arrives at the mapping stage with pre-populated AI suggestions surfaced alongside raw source data.
2.
Optimistic Interaction:
The Target Schema panel expands instantly on selection; a Ghost State placeholder bridges the 5s backend lookup.
3.
Structural Wayfinding:
Highlighting a suggested field auto-traverses the schema tree to reveal the target field’s nested hierarchy and parent object.
4.
Mapping Dissociation:
User servers the link; the system updates dependencies and returns the source field to the unmapped pool.
5.
Alternative Inference (evidence and reasoning):
Architect reviews confidence scores for secondary recommendations, offering a “Human-in-the-Loop” choice for complex mappings.
6.
The Trust Audit:
Governance-Led validation: Decoupling accuracy from risk.
The audit modal surfaces the PII Governance loop, allowing Architects to reconcile high-confidence AI matches with organizational safety policies. By exposing the ‘Why’ behind both the match score and the risk flag, we provide the Explainable AI (XAI) necessary for an audited, compliant handoff.”
7.
Inventory Grooming:
Bulk-selection and filtering allow the Architect to prune irrelevant source fields, reducing the data ingestion footprint.
8.
Validation & Handoff:
Finalized mappings are committed to dataflow, transitioning the Architect from configuration to ingestion review
The Final Handshake (Trust & Governance)
From a “Black Box” to Explainable AI by Standardizing the Human-in-the-Loop Experience
The final release successfully dismantled the ‘Trust Gap’ by moving from an opaque, automated process to an Explainable AI (XAI) framework. By decoupling Semantic Accuracy (the ML match) from Data Compliance (the PII flag), we empowered Architects to make high-stakes decisions without slowing down their workflow. This turned a technical bottleneck into a strategic governance feature.
System Impact & Results
Closing the Handshake: Quantifying Human-AI Synergy
40-60%
Faster to First Usable Segment
Reduced onboarding time through AI-assisted mapping
25-40%
Mapping Accuracy Lift
Human-in-the-loop verification & ML suggestions
-30%
Fewer Mapping-Related Segmentation breakages
Improved downstream data integrity
90% Confidence Threshold
3 Entry Points to 1 Unified UI
Engineering & Performance Impact
Perceived Performance
Optimistic ghost states masked a 5-second backend latency, reducing interaction friction and preventing session abandonment during complex ingestions.
System Scalability
Modular service components enabled mapping logic reuse across three Adobe Cloud entry points, significantly reducing redundant UI development.
Before: Manual Mapping
After: AI-Assisted Mapping
Field-by-field manual matching
ML-powered recommendations
No confidence signal
Confidence score & rationale
Late-stage PII discovery
Inline governance checks
High audit overhead
Targeted human verification
Errors discovered downstream
Errors prevented pre-ingestion
Governance & Data Quality
100% Compliance by Design
Integrating the PII Governance Loop directly into the mapping flow ensured that 100% of sensitive fields were flagged before ingestion, preventing downstream legal risks and costly data deletions
Mapping Accuracy
Human-in-the-loop verification combined with ML suggestions resulted in higher data fidelity within the Schema Registry, ensuring cleaner “downstream” profile segments for Marketing Ops.
“We eliminated an entire class of ingestion failures that previously required manual intervention, once ML suggestions were grounded in schema truth and governance checks.”
– Product Manager, Data Platform Engineering
Outcomes
The Strategic Ripple Effect
Long-term shifts in behavior, trust, and organizational scalling
Persona Elevation
From Doer to Reviewer
We successfully shifted the Data Architect from a “Data Entry” role to a “Strategic Oversight” role. This reclamation of cognitive load allows them to manage significantly higher data volumes
The Trust Floor
From Black Box to Glass Box
Modular service components enabled mapping logic reuse across three Adobe Cloud entry points, significantly reducing redundant UI development.
The Blueprinted Handshake
From Feature to System Standard
Modular service components enabled mapping logic reuse across three Adobe Cloud entry points, significantly reducing redundant UI development.
System Impact, From Component to Ecosystem
Data Mapping Component
AI-Trust Standard
Integrated into Adobe’s XAI guidelines
Ghost States Pattern
Adopted across Adobe Cloud to high-latency operations
Design System
Blueprint for Human-AI interaction patterns
Related Case Studies
Let’s Work Together
Interested in collaborating on complex UI/UX challenges involving data, AI, or enterprise systems?
I’d love to explore how thoughtful design can drive clarity and business impact.
Get In Touch
About Kelli
Product Designer | AI x Data Systems
Passionate about turning complex data and AI systems into clear, trustworthy, human-centered experiences
Based in: San Francisco, CA
© 2026 Kelli Nordfelt
Overview
Problem
Technical Wall
Design Pivot
System Impact
Outcomes
AI-assisted Data Mapping
Human-AI Data Workflows that Reduce the Technical Floor for Global Onboarding
Solving for “Ingestion Debt” through ML-assisted mapping and Friction-by-Design governance
Data Mapping Overview
Project Snapshot
The Challenge
High-risk manual mapping created “Ingestion debt”, and errors discovered only after data reached the activation layer
The Solution
An ML-assisted mapping framework that balances automation with “Friction-by-Design” for PII governance.
Key Results
40-60% faster onboarding and a `30% reduction in mapping-related pipeline failures.
Primary Users
Data Engineers, Data Architects, and Marketing Ops teams.
Overview
This 0-GA initiative spanned 18 months, evolving from a manual field-matching tool into a Strategic Data Bridge. By standardizing how diverse source data enters the ecosystem, we established the foundational UX patterns for ML-recommendations, template reuse, and proactive drift monitoring.
My Role
As the Primary Design Lead, I orchestrated the end-to-end workflow across ingestion and mapping. I partnered with 2 Product Managers (including a domain SME) and a squad of Backend/Frontend Engineers to translate complex ML confidence scores into actionable, high-integrity UI patterns.
The Problem
The Cost of “Invisible Errors”
The Core Tension: Speed vs Governance
Historically, mapping diverse source data into a standardized schema was a “black box” operation. Users were forced to map fields manually without knowing if the data types matched downstream requirements, leading to what I termed “Ingestion Debt”.
Silent Pipeline Pollution
Architects would “successfully” map fields that appeared valid in the UI, but contained semantic mismatches. These errors remained invisible until they triggered failures in downstream segmentation.
The Late-Stage Error Loop
Errors were only discovered at the “Activation” layer (often weeks after initial setup), forcing teams to restart the 18-month onboarding cycles from scratch.
The Governance Risk
Without clear visibility into PII (Personally Identifiable Information), sensitive data often leaked into non-compliant destinations.
Critical
Mis-mapped fields produced incomplete or inaccurate audiences
High
Source onboarding and schema selection lacked clarity
High
Errors surfaced late, triggering rework and support tickets
Medium
No templates or reuse lead to repetitive manual effort
Source Fields Flow Analysis
Visualizing the Fragmentation Gap: Identifying where unmapped source fields caused downstream segmentation to fail.
Correct Mappings
90% • Activation-ready
10% • Shadow QA
Incorrect Mappings
60% • Failed activation
10% • Low-precision segment
Unmapped Fields
100% • Backlog

Backlog (10)
Low-precision segment (08)
Failed activation (12)
QA monitoring (07)
Activation-ready (63)
Correct (70)
Incorrect (20)
Unmapped (10)
(100) Source Fields
2 Stages Earlier
Error detection improvements
↓ 2 Reduced Costs
Fix issues before campaign launch
↑ Confidence
In automation and personalization
Error Discovery Timeline
Incorrect or incomplete mappings led to mismatched audiences and reduced confidence in automation and personalization outcomes
Source
connected
Field Mapping/
Validation
(Before)
Error Detected
(Before)
Error Detected
Campaign
Source
connected
Field Mapping/
Validation
Unified
Profile Schema
Segment
Build
Campaign

Source
connected
(Proposed)
Early Detection
Field Mapping/
Validation
Segment
Build
Campaign
Cross-team Journey Map
Mapping workflow and failure analysis helped identify where segmentation breaks, why it happens, and who it impacts.
Critical
Late error detection & schema drift created unclear mapping outcomes
Leads to rework loops, broken segments, and failed activation
High
Ambiguous fields along with tribal knowledge drive mis-mapping and low trust
Slows onboarding and reduces confidence in audiences
Medium
Manual and repetitive mapping with limited tooling
Increases time to first segment and hurts scalability
Source Connection
Field Discovery
Mapping
Validation
Publishing
Segment Creation
Activation
Data Engineer
TASK
Configure source systems & credentials
TASK
Scan and identify available fields
TASK
Map source to target schema
TASK
Test data transformation
Data Ops
TASK
Review connection permissions
TASK
Validate mapping rules
TASK
Deploy to production
Marketing Ops
TASK
Define business field requirements
TASK
Build audience segments
TASK
Launch campaigns
Analyst
TASK
Review field relevance
TASK
Verify data accuracy
TASK
Define segment criteria
System automation
TASK
Run automated checks
TASK
Schedule sync jobs
TASK
Sync to activation platforms
The Technical Wall
The Probability vs Policy Paradox
The Constraint: AI is Probabilistic, Governance is Binary
The core technical challenge was that out ML models produced Confidence Scores, not certainties. In a consumer app, an 80% match is a win; in Enterprise PII (Personally Identifiable Information) mapping, a 20% margin of error is a legal and structural liability.
The Black Box Problem
The Wall
Early versions of the ML-mapping engine “just worked,” but provided no “why” behind the suggestions.
User Mistrust
Architects, wary of “Silent Pipeline Pollution.” would spend more time auditing the AI’s work than it would have taken to map the fields manually.
Performance Reality
Backend processing for real-time ML suggestions across 1,000+ fields introduced a 5-second latency, threatening the “consumer-grade” flow UX had initially promised.
The Mapping Paradox
If we automated everything, we lost human accountability for PII. If we automated nothing, we couldn’t lower the technical floor for onboarding.
Confidence vs. Risk — Human Accountability Matrix
AI-driven data mapping governance framework
(Identifying the “Danger Zone”, where high-sensitivity fields, were being mapped with low-to-medium confidence scores)
Restricted / PII
Data Sensitivity Level
Policy-Driven
Public
DANGER ZONE
Mandatory Human Review
Uncertain output applied to regulated data creates unacceptable risk.


SSN
GOVERNANCE ZONE
Secondary Verification
High confidence does not override policy-driven accountability.
SSN
AUDIT ZONE
Bulk Review
Uncertainty is acceptable when failure impact is low.
SAFE ZONE
Auto-Accept
Low-risk fields can be safely automated to reduce onboarding friction.
0%
25%
50%
75%
100%
Uncertainty
ML Confidence Score
Latency Sequence map
Server-Side Execution Time & Asynchronous Constraint

Non-blocking/Staged UI
(Suggestion Pending)
User / UI
ML Engine
Selects source field
[e.g., ‘src_email]
Analyze
Semantic patterns
Suggestion Pending
(non-blocking/Staged UI)
Schema Registry
Return Schema Metadata
Fetch Schema Definitions
Governance
Check PII Constraints
200: [Suggested+Field:
“emailPrimary”, PII: true]
User/UI
Trigger Manual Verification
(Friction-by-Design)
Asynchronous Constraint
User action
Backend loop
~5s Latency Wall
The “Black Box” Explainability Logic
Explainability doesn’t increase certainty, it increases accountability
BEFORE: The Black Box
Source Field:
src_email
ML Engine
Target Field:
?
Why this Match
AFTER: Explainable Logic
Source Field:
src_email
ML Engine
Semantic Analysis
Historical Mapping
Target Field:
emailPrimary
The Design Pivot
From System Constraints to User Flows
Ecosystem Mapping & Entry points
Before solving the mapping interface, we had to solve for the “Where”. Mapping isn’t a single-page task; it’s a utility that needs to exist across the Adobe ecosystem (Ingestion, Schema Editor, Profile). Instead of the bespoke page, I designed a Modular Service Component.
Cross-team Kick-off Workshop: Alignment on the “Handshake” lifecycle
During these sprints we focused on:
- Understanding the problem, and set our expected outcomes
- Worked through and understand technology dependencies
- Explored user goals and value statements
- Developed low-fi solutions (design and dev)
- Presented and validated with stakeholders and customers
Macro-level Entry Point Diagram
How this “handshake” plugs into different Adobe Experience Cloud apps
Data Ingestion Workflow: Cross-Functional Orchestration
Where Marketing Ops, Data Engineers, and Data Architects intersect
The ‘Handshake’ occurs at the critical juncture between Selecting Raw Data Mapping and Dataflow Review.
Workflow recommendations
Reduced steps within workflows and unified design system patterns
Defining the Handshake Grammar (Anatomy & Specs)
Standardizing the communication between the Architect and the Machine. Raw metadata (Sources) and standardized XDM (Target Schema) speak different languages.
Users were confused by mismatched datatypes. To establish a Metadata-First Visual Grammar I aligned the UI with Adobe’s “Spectrum” design system but added specific specs for AI-confidence and data-origin metadata.
Patterns and Guiding Principles
Identified important questions to keep in mind during exploration
- How might we remind users why we are normalizing the data?
- How do we make sure our solutions are performance based?
- How might the user expect to approach the tools?
- How can we reduce redundancies?
Spectrum Design System Guidelines
(*Reference guide for all Adobe Cloud Editors)
Anatomy
Metadata transparency and system alignment
Behavioral Design
State management and the 5-second latency solution
Mapping Fields Anatomy
Source field – Responsive field container
Mapping status
Target schema field – Responsive field container
Field nameSpace
Action
Field nameSpace
Data type
Alert
Action
fieldNameHereXyzAndCanBeVerylongFieldNameHereXyzAndCanBeVerylong
fieldNameHereXyzAndCanBeVerylongFieldNameHereXyzAndCanBeVerylong
5
fieldNameHereXyzAndCanBeVerylongFieldNameHereXyzAndCanBeVerylong
fieldNameHereXyzAndCanBeVerylongFieldNameHereXyzAndCanBeVerylong
fieldNameHereXyzAndCanBeVerylongFieldNameHereXyzAndCanBeVerylong
fieldNameHereXyzAndCanBeVerylongFieldNameHereXyzAndCanBeVerylong
fieldNameHereXyzAndCanBeVerylongFieldNameHereXyzAndCanBeVerylong
fieldNameHereXyzAndCanBeVerylongFieldNameHereXyzAndCanBeVerylong
fieldNameHereXyzAndCanBeVerylongFieldNameHereXyzAndCanBeVerylong
Map target field
Navigating the 5-second Gap
Initial Engineering prototypes confirmed the 5-second server-side delay. A standard loading spinner created a “Momentum Gap” that frustrated power users.
Users were confused by mismatched datatypes. To establish a Metadata-First Visual Grammar I aligned the UI with Adobe’s “Spectrum” design system but added specific specs for AI-confidence and data-origin metadata.
Rapid prototyping w/ Engineering
Different concept views to show levels of scoring details and when to progressively explain them if needed to apply changes and to test “Ghost States.”
Exploring with “guessing” user intent and bulk selecting recommended mappings by schema “Mixins” (field groups). and focusing on the Schema view vs field to field mappings.
In an agile fashion I worked closely with engineering to explore hierarchy of what views are most important for the user when reviewing field mapping recommendations and “Why” they were recommended vs users intent for ingestion this source of raw data.
The Strategy of Omission (Deferred Features)
Roadmap Prioritizaiton: Balancing MVP Speed with System Sxalability
To ensure a successful V1 launch against tight engineering constraints, I led the effort to prioritize ‘High-Value/Low-Effort’ logic over ‘Nice-to-Have’ convenience features. We strategically deffered several complex patterns to focus on the core ‘Handshake’ reliabilty.”
Feature
Status
Design Rationale
XAI Rationale
Launched
Critical for building user trust in the AI “Black Box.”
Ghost States
Launched
Essential to solve the 5s Asynchronous Constraint.
Bulk-Mapping
Deferred
Risk of high-volume error propagation; prioritized precision.
Numerical Scoring
Deferred
Focused on qualitative trust over quantitative “guessing.”
The Asynchronous Handshake: Orchestrating Human-AI Collaboration
A State-Based Storyboards: Solving for Momentum, Explainability, and Governance
1.
Contextual Entry:
Architect arrives at the mapping stage with pre-populated AI suggestions surfaced alongside raw source data.
2.
Optimistic Interaction:
The Target Schema panel expands instantly on selection; a Ghost State placeholder bridges the 5s backend lookup.
3.
Structural Wayfinding:
Highlighting a suggested field auto-traverses the schema tree to reveal the target field’s nested hierarchy and parent object.
4.
Mapping Dissociation:
User servers the link; the system updates dependencies and returns the source field to the unmapped pool.
5.
Alternative Inference (evidence and reasoning):
Architect reviews confidence scores for secondary recommendations, offering a “Human-in-the-Loop” choice for complex mappings.
6.
The Trust Audit:
Governance-Led validation: Decoupling accuracy from risk.
The audit modal surfaces the PII Governance loop, allowing Architects to reconcile high-confidence AI matches with organizational safety policies. By exposing the ‘Why’ behind both the match score and the risk flag, we provide the Explainable AI (XAI) necessary for an audited, compliant handoff.”
7.
Inventory Grooming:
Bulk-selection and filtering allow the Architect to prune irrelevant source fields, reducing the data ingestion footprint.
8.
Validation & Handoff:
Finalized mappings are committed to dataflow, transitioning the Architect from configuration to ingestion review
The Final Handshake (Trust & Governance)
From a “Black Box” to Explainable AI by Standardizing the Human-in-the-Loop Experience
The final release successfully dismantled the ‘Trust Gap’ by moving from an opaque, automated process to an Explainable AI (XAI) framework. By decoupling Semantic Accuracy (the ML match) from Data Compliance (the PII flag), we empowered Architects to make high-stakes decisions without slowing down their workflow. This turned a technical bottleneck into a strategic governance feature.
System Impact & Results
Closing the Handshake: Quantifying Human-AI Synergy
40-60%
Faster to First Usable Segment
Reduced onboarding time through AI-assisted mapping
25-40%
Mapping Accuracy Lift
Human-in-the-loop verification & ML suggestions
-30%
Fewer Mapping-Related Segmentation breakages
Improved downstream data integrity
90% Confidence Threshold
3 Entry Points to 1 Unified UI
Engineering & Performance Impact
Perceived Performance
Optimistic ghost states masked a 5-second backend latency, reducing interaction friction and preventing session abandonment during complex ingestions.
System Scalability
Modular service components enabled mapping logic reuse across three Adobe Cloud entry points, significantly reducing redundant UI development.
Before: Manual Mapping
After: AI-Assisted Mapping
Field-by-field manual matching
ML-powered recommendations
No confidence signal
Confidence score & rationale
Late-stage PII discovery
Inline governance checks
High audit overhead
Targeted human verification
Errors discovered downstream
Errors prevented pre-ingestion
Governance & Data Quality
100% Compliance by Design
Integrating the PII Governance Loop directly into the mapping flow ensured that 100% of sensitive fields were flagged before ingestion, preventing downstream legal risks and costly data deletions
Mapping Accuracy
Human-in-the-loop verification combined with ML suggestions resulted in higher data fidelity within the Schema Registry, ensuring cleaner “downstream” profile segments for Marketing Ops.
“We eliminated an entire class of ingestion failures that previously required manual intervention, once ML suggestions were grounded in schema truth and governance checks.”
– Product Manager, Data Platform Engineering
Outcomes
The Strategic Ripple Effect
Long-term shifts in behavior, trust, and organizational scalling
Persona Elevation
From Doer to Reviewer
We successfully shifted the Data Architect from a “Data Entry” role to a “Strategic Oversight” role. This reclamation of cognitive load allows them to manage significantly higher data volumes
The Trust Floor
From Black Box to Glass Box
Modular service components enabled mapping logic reuse across three Adobe Cloud entry points, significantly reducing redundant UI development.
The Blueprinted Handshake
From Feature to System Standard
Modular service components enabled mapping logic reuse across three Adobe Cloud entry points, significantly reducing redundant UI development.
System Impact, From Component to Ecosystem
Data Mapping Component
AI-Trust Standard
Integrated into Adobe’s XAI guidelines
Ghost States Pattern
Adopted across Adobe Cloud to high-latency operations
Design System
Blueprint for Human-AI interaction patterns
Let’s Work Together
Interested in collaborating on complex UI/UX challenges involving data, AI, or enterprise systems?
I’d love to explore how thoughtful design can drive clarity and business impact.
Get In Touch
About Kelli
Product Designer | AI x Data Systems
Passionate about turning complex data and AI systems into clear, trustworthy, human-centered experiences
Based in: San Francisco, CA
© 2026 Kelli Nordfelt


Overview

Problem

Technical Wall

Design Pivot
System Impact

Outcomes
AI-assisted Data Mapping
Human-AI Data Workflows that Reduce the Technical Floor for Global Onboarding
Solving for “Ingestion Debt” through ML-assisted mapping and Friction-by-Design governance
Data Mapping Overview

Project Snapshot
The Challenge
High-risk manual mapping created “Ingestion debt”, and errors discovered only after data reached the activation layer
The Solution
An ML-assisted mapping framework that balances automation with “Friction-by-Design” for PII governance.
Key Results
40-60% faster onboarding and a `30% reduction in mapping-related pipeline failures.
Primary Users
Data Engineers, Data Architects, and Marketing Ops teams.
Overview
This 0-GA initiative spanned 18 months, evolving from a manual field-matching tool into a Strategic Data Bridge. By standardizing how diverse source data enters the ecosystem, we established the foundational UX patterns for ML-recommendations, template reuse, and proactive drift monitoring.
My Role
As the Primary Design Lead, I orchestrated the end-to-end workflow across ingestion and mapping. I partnered with 2 Product Managers (including a domain SME) and a squad of Backend/Frontend Engineers to translate complex ML confidence scores into actionable, high-integrity UI patterns.
The Problem
The Cost of “Invisible Errors”
The Core Tension: Speed vs Governance
Historically, mapping diverse source data into a standardized schema was a “black box” operation. Users were forced to map fields manually without knowing if the data types matched downstream requirements, leading to what I termed “Ingestion Debt”.
Silent Pipeline Pollution
Architects would “successfully” map fields that appeared valid in the UI, but contained semantic mismatches. These errors remained invisible until they triggered failures in downstream segmentation.
The Late-Stage Error Loop
Errors were only discovered at the “Activation” layer (often weeks after initial setup), forcing teams to restart the 18-month onboarding cycles from scratch.
The Governance Risk
Without clear visibility into PII (Personally Identifiable Information), sensitive data often leaked into non-compliant destinations.
Critical
Mis-mapped fields produced incomplete or inaccurate audiences
High
Source onboarding and schema selection lacked clarity
High
Errors surfaced late, triggering rework and support tickets
Medium
No templates or reuse lead to repetitive manual effort
Source Fields Flow Analysis
Visualizing the Fragmentation Gap: Identifying where unmapped source fields caused downstream segmentation to fail.
Correct Mappings
90% • Activation-ready
10% • Shadow QA
Incorrect Mappings
60% • Failed activation
10% • Low-precision segment
Unmapped Fields
100% • Backlog


Backlog (10)
Low-precision segment (08)
Failed activation (12)
QA monitoring (07)
Activation-ready (63)
Correct (70)
Incorrect (20)
Unmapped (10)
(100) Source Fields
2 Stages Earlier
Error detection improvements
↓ 2 Reduced Costs
Fix issues before campaign launch
↑ Confidence
In automation and personalization
Error Discovery Timeline
Incorrect or incomplete mappings led to mismatched audiences and reduced confidence in automation and personalization outcomes
Source
connected
Field Mapping/
Validation
(Before)
Error Detected
(Before)
Error Detected
Campaign
Source
connected
Field Mapping/
Validation
Unified
Profile Schema
Segment
Build
Campaign
Source
connected
(Proposed)
Early Detection
Field Mapping/
Validation
Segment
Build
Campaign
Cross-team Journey Map
Mapping workflow and failure analysis helped identify where segmentation breaks, why it happens, and who it impacts.
Critical
Late error detection & schema drift created unclear mapping outcomes
Leads to rework loops, broken segments, and failed activation
High
Ambiguous fields along with tribal knowledge drive mis-mapping and low trust
Slows onboarding and reduces confidence in audiences
Medium
Manual and repetitive mapping with limited tooling
Increases time to first segment and hurts scalability
Source Connection
Field Discovery
Mapping
Validation
Publishing
Segment Creation
Activation
Data Engineer
TASK

Configure source systems & credentials
TASK

Scan and identify available fields
TASK
Map source to target schema
TASK
Test data transformation
Data Ops
TASK
Review connection permissions
TASK
Validate mapping rules
TASK
Deploy to production
Marketing Ops
TASK

Define business field requirements
TASK
Build audience segments
TASK
Launch campaigns
Analyst
TASK
Review field relevance
TASK
Verify data accuracy
TASK
Define segment criteria
System automation
TASK
Run automated checks
TASK
Schedule sync jobs
TASK
Sync to activation platforms
The Technical Wall
The Probability vs Policy Paradox
The Constraint: AI is Probabilistic, Governance is Binary
The core technical challenge was that out ML models produced Confidence Scores, not certainties. In a consumer app, an 80% match is a win; in Enterprise PII (Personally Identifiable Information) mapping, a 20% margin of error is a legal and structural liability.
The Black Box Problem
The Wall
Early versions of the ML-mapping engine “just worked,” but provided no “why” behind the suggestions.
User Mistrust
Architects, wary of “Silent Pipeline Pollution.” would spend more time auditing the AI’s work than it would have taken to map the fields manually.
Performance Reality
Backend processing for real-time ML suggestions across 1,000+ fields introduced a 5-second latency, threatening the “consumer-grade” flow UX had initially promised.
The Mapping Paradox
If we automated everything, we lost human accountability for PII. If we automated nothing, we couldn’t lower the technical floor for onboarding.
Confidence vs. Risk — Human Accountability Matrix
AI-driven data mapping governance framework
(Identifying the “Danger Zone”, where high-sensitivity fields, were being mapped with low-to-medium confidence scores)
Restricted / PII
Data Sensitivity Level
Policy-Driven
Public
DANGER ZONE
Mandatory Human Review
Uncertain output applied to regulated data creates unacceptable risk.


SSN
GOVERNANCE ZONE
Secondary Verification
High confidence does not override policy-driven accountability.
SSN
AUDIT ZONE
Bulk Review
Uncertainty is acceptable when failure impact is low.
SAFE ZONE
Auto-Accept
Low-risk fields can be safely automated to reduce onboarding friction.
0%
25%
50%
75%
100%
Uncertainty
ML Confidence Score
Latency Sequence map
Server-Side Execution Time & Asynchronous Constraint
Non-blocking/Staged UI
(Suggestion Pending)
User / UI
ML Engine
Selects source field
[e.g., ‘src_email]
Analyze
Semantic patterns
Suggestion Pending
(non-blocking/Staged UI)
Schema Registry
Return Schema Metadata
Fetch Schema Definitions
Governance
Check PII Constraints
200: [Suggested+Field:
“emailPrimary”, PII: true]
User/UI
Trigger Manual Verification
(Friction-by-Design)
Asynchronous Constraint
User action
Backend loop
~5s Latency Wall
The “Black Box” Explainability Logic
Explainability doesn’t increase certainty, it increases accountability
BEFORE: The Black Box
Source Field:
src_email
ML Engine
Target Field:
?
Why this Match
AFTER: Explainable Logic
Source Field:
src_email
ML Engine
Semantic Analysis
Historical Mapping
Target Field:
emailPrimary
The Design Pivot
From System Constraints to User Flows
Ecosystem Mapping & Entry points
Before solving the mapping interface, we had to solve for the “Where”. Mapping isn’t a single-page task; it’s a utility that needs to exist across the Adobe ecosystem (Ingestion, Schema Editor, Profile). Instead of the bespoke page, I designed a Modular Service Component.
Cross-team Kick-off Workshop: Alignment on the “Handshake” lifecycle
During these sprints we focused on:
- Understanding the problem, and set our expected outcomes
- Worked through and understand technology dependencies
- Explored user goals and value statements
- Developed low-fi solutions (design and dev)
- Presented and validated with stakeholders and customers
Macro-level Entry Point Diagram
How this “handshake” plugs into different Adobe Experience Cloud apps
Data Ingestion Workflow: Cross-Functional Orchestration
Where Marketing Ops, Data Engineers, and Data Architects intersect
The ‘Handshake’ occurs at the critical juncture between Selecting Raw Data Mapping and Dataflow Review.
Workflow recommendations
Reduced steps within workflows and unified design system patterns
Defining the Handshake Grammar (Anatomy & Specs)
Standardizing the communication between the Architect and the Machine. Raw metadata (Sources) and standardized XDM (Target Schema) speak different languages.
Users were confused by mismatched datatypes. To establish a Metadata-First Visual Grammar I aligned the UI with Adobe’s “Spectrum” design system but added specific specs for AI-confidence and data-origin metadata.
Patterns and Guiding Principles
Identified important questions to keep in mind during exploration
- How might we remind users why we are normalizing the data?
- How do we make sure our solutions are performance based?
- How might the user expect to approach the tools?
- How can we reduce redundancies?
Spectrum Design System Guidelines
(*Reference guide for all Adobe Cloud Editors)
Anatomy
Metadata transparency and system alignment
Behavioral Design
State management and the 5-second latency solution
Mapping Fields Anatomy
Source field – Responsive field container
Mapping status
Target schema field – Responsive field container
Field nameSpace
Action
Field nameSpace
Data type
Alert
Action
fieldNameHereXyzAndCanBeVerylongFieldNameHereXyzAndCanBeVerylong
fieldNameHereXyzAndCanBeVerylongFieldNameHereXyzAndCanBeVerylong
5
fieldNameHereXyzAndCanBeVerylongFieldNameHereXyzAndCanBeVerylong
fieldNameHereXyzAndCanBeVerylongFieldNameHereXyzAndCanBeVerylong
fieldNameHereXyzAndCanBeVerylongFieldNameHereXyzAndCanBeVerylong
fieldNameHereXyzAndCanBeVerylongFieldNameHereXyzAndCanBeVerylong
fieldNameHereXyzAndCanBeVerylongFieldNameHereXyzAndCanBeVerylong
fieldNameHereXyzAndCanBeVerylongFieldNameHereXyzAndCanBeVerylong
fieldNameHereXyzAndCanBeVerylongFieldNameHereXyzAndCanBeVerylong
Map target field
Navigating the 5-second Gap
Initial Engineering prototypes confirmed the 5-second server-side delay. A standard loading spinner created a “Momentum Gap” that frustrated power users.
Users were confused by mismatched datatypes. To establish a Metadata-First Visual Grammar I aligned the UI with Adobe’s “Spectrum” design system but added specific specs for AI-confidence and data-origin metadata.
Rapid prototyping w/ Engineering
Different concept views to show levels of scoring details and when to progressively explain them if needed to apply changes and to test “Ghost States.”
Exploring with “guessing” user intent and bulk selecting recommended mappings by schema “Mixins” (field groups). and focusing on the Schema view vs field to field mappings.
In an agile fashion I worked closely with engineering to explore hierarchy of what views are most important for the user when reviewing field mapping recommendations and “Why” they were recommended vs users intent for ingestion this source of raw data.
The Strategy of Omission (Deferred Features)
Roadmap Prioritization: Balancing MVP Speed with System Scalability
To ensure a successful V1 launch against tight engineering constraints, I led the effort to prioritize ‘High-Value/Low-Effort’ logic over ‘Nice-to-Have’ convenience features. We strategically deferred several complex patterns to focus on the core ‘Handshake’ reliability.”
Feature
Status
Design Rationale
XAI Rationale
Launched
Critical for building user trust in the AI “Black Box.”
Ghost States
Launched
Essential to solve the 5s Asynchronous Constraint.
Bulk-Mapping
Deferred
Risk of high-volume error propagation; prioritized precision.
Numerical Scoring
Deferred
Focused on qualitative trust over quantitative “guessing.”
The Asynchronous Handshake: Orchestrating Human-AI Collaboration
A State-Based Storyboards: Solving for Momentum, Explainability, and Governance
1.
Contextual Entry:
Architect arrives at the mapping stage with pre-populated AI suggestions surfaced alongside raw source data.
2.
Optimistic Interaction:
The Target Schema panel expands instantly on selection; a Ghost State placeholder bridges the 5s backend lookup.
3.
Structural Wayfinding:
Highlighting a suggested field auto-traverses the schema tree to reveal the target field’s nested hierarchy and parent object.
4.
Mapping Dissociation:
User servers the link; the system updates dependencies and returns the source field to the unmapped pool.
5.
Alternative Inference (evidence and reasoning):
Architect reviews confidence scores for secondary recommendations, offering a “Human-in-the-Loop” choice for complex mappings.
6.
The Trust Audit:
Governance-Led validation: Decoupling accuracy from risk.
The audit modal surfaces the PII Governance loop, allowing Architects to reconcile high-confidence AI matches with organizational safety policies. By exposing the ‘Why’ behind both the match score and the risk flag, we provide the Explainable AI (XAI) necessary for an audited, compliant handoff.”
7.
Inventory Grooming:
Bulk-selection and filtering allow the Architect to prune irrelevant source fields, reducing the data ingestion footprint.
8.
Validation & Handoff:
Finalized mappings are committed to dataflow, transitioning the Architect from configuration to ingestion review
The Final Handshake (Trust & Governance)
From a “Black Box” to Explainable AI by Standardizing the Human-in-the-Loop Experience
The final release successfully dismantled the ‘Trust Gap’ by moving from an opaque, automated process to an Explainable AI (XAI) framework. By decoupling Semantic Accuracy (the ML match) from Data Compliance (the PII flag), we empowered Architects to make high-stakes decisions without slowing down their workflow. This turned a technical bottleneck into a strategic governance feature.
System Impact & Results
Closing the Handshake: Quantifying Human-AI Synergy
40-60%
Faster to First Usable Segment
Reduced onboarding time through AI-assisted mapping
25-40%
Mapping Accuracy Lift
Human-in-the-loop verification & ML suggestions
-30%
Fewer Mapping-Related Segmentation breakages
Improved downstream data integrity
90% Confidence Threshold
3 Entry Points to 1 Unified UI
Engineering & Performance Impact
Perceived Performance
Optimistic ghost states masked a 5-second backend latency, reducing interaction friction and preventing session abandonment during complex ingestions.
System Scalability
Modular service components enabled mapping logic reuse across three Adobe Cloud entry points, significantly reducing redundant UI development.
Before: Manual Mapping
After: AI-Assisted Mapping
Field-by-field manual matching
ML-powered recommendations
No confidence signal
Confidence score & rationale
Late-stage PII discovery
Inline governance checks
High audit overhead
Targeted human verification
Errors discovered downstream
Errors prevented pre-ingestion
Governance & Data Quality
Compliance by Design
Integrating the PII Governance Loop directly into the mapping flow ensured that 100% of sensitive fields were flagged before ingestion, preventing downstream legal risks and costly data deletions
Mapping Accuracy
Human-in-the-loop verification combined with ML suggestions resulted in higher data fidelity within the Schema Registry, ensuring cleaner “downstream” profile segments for Marketing Ops.
“We eliminated an entire class of ingestion failures that previously required manual intervention, once ML suggestions were grounded in schema truth and governance checks.”
– Product Manager, Data Platform Engineering
Outcomes
The Strategic Ripple Effect
Long-term shifts in behavior, trust, and organizational scalling
Persona Elevation
From Doer to Reviewer
We successfully shifted the Data Architect from a “Data Entry” role to a “Strategic Oversight” role. This reclamation of cognitive load allows them to manage significantly higher data volumes
The Trust Floor
From Black Box to Glass Box
Modular service components enabled mapping logic reuse across three Adobe Cloud entry points, significantly reducing redundant UI development.
The Blueprinted Handshake
From Feature to System Standard
Modular service components enabled mapping logic reuse across three Adobe Cloud entry points, significantly reducing redundant UI development.
System Impact, From Component to Ecosystem
Data Mapping Component
AI-Trust Standard
Integrated into Adobe’s XAI guidelines
Ghost States Pattern
Adopted across Adobe Cloud to high-latency operations
Design System
Blueprint for Human-AI interaction patterns
Related Case Studies
Let’s Work Together
Interested in collaborating on complex UI/UX challenges involving data, AI, or enterprise systems?
I’d love to explore how thoughtful design can drive clarity and business impact.

Get In Touch

About Kelli
Product Designer | AI x Data Systems
Passionate about turning complex data and AI systems into clear, trustworthy, human-centered experiences
Based in: San Francisco, CA
© 2026 Kelli Nordfelt